OPEN-SOURCE SCRIPT
BTC Volatility Forecast
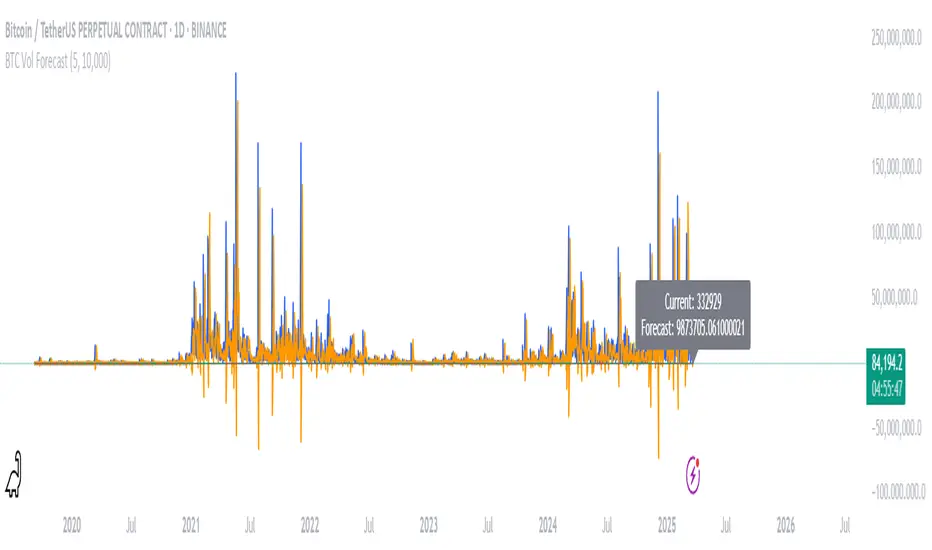
The "BTC Volatility Forecast" indicator is designed to help traders anticipate Bitcoin (BTC) price volatility by analyzing historical daily price ranges and projecting future fluctuations. Inspired by advanced volatility forecasting studies, it calculates an approximate realized variance using the squared difference between each day’s high and low prices. By applying a simple linear regression model over the past five days of variance data (customizable via the "Lag Period" input), the indicator provides a forecast for the next day’s volatility. This makes it a valuable tool for BTC traders looking to gauge potential market turbulence and adjust their strategies accordingly.
On the chart, the indicator displays two lines: a blue solid line representing the current realized variance and an orange line showing the forecasted volatility for the upcoming day. Traders can set a "Volatility Threshold" to trigger alerts when the forecast exceeds a specified level, aiding in risk management or trade planning. A debug label on the last bar also shows the exact current and forecasted values for quick reference. While this version uses daily data for simplicity, it captures the essence of volatility prediction and can be a starting point for understanding BTC market dynamics—perfect for both novice and experienced traders on TradingView.
On the chart, the indicator displays two lines: a blue solid line representing the current realized variance and an orange line showing the forecasted volatility for the upcoming day. Traders can set a "Volatility Threshold" to trigger alerts when the forecast exceeds a specified level, aiding in risk management or trade planning. A debug label on the last bar also shows the exact current and forecasted values for quick reference. While this version uses daily data for simplicity, it captures the essence of volatility prediction and can be a starting point for understanding BTC market dynamics—perfect for both novice and experienced traders on TradingView.
Skrip sumber terbuka
Dalam semangat TradingView sebenar, pencipta skrip ini telah menjadikannya sumber terbuka, jadi pedagang boleh menilai dan mengesahkan kefungsiannya. Terima kasih kepada penulis! Walaupuan anda boleh menggunakan secara percuma, ingat bahawa penerbitan semula kod ini tertakluk kepada Peraturan Dalaman.
Penafian
Maklumat dan penerbitan adalah tidak bertujuan, dan tidak membentuk, nasihat atau cadangan kewangan, pelaburan, dagangan atau jenis lain yang diberikan atau disahkan oleh TradingView. Baca lebih dalam Terma Penggunaan.