Custom Fibonacci Support & Resistance Lines
The script detects the latest confirmed swing high and swing low on the chart and calculates two adaptive lines:
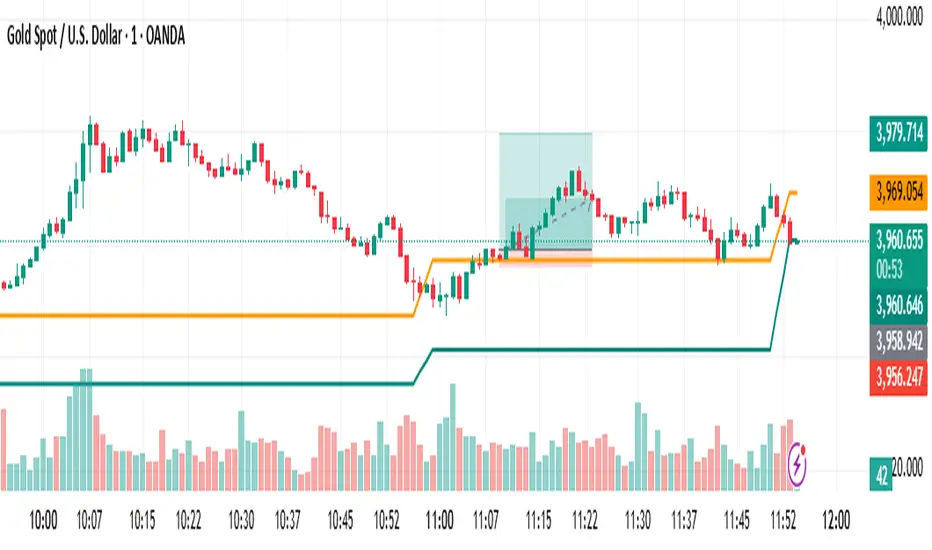
A Fibonacci Support Line below price (retracement from swing high to swing low).
A Fibonacci Resistance Line above price (retracement from swing low to swing high).
Both levels are smoothed using a simple moving average for a cleaner visual appearance — similar to an adaptive support/resistance band that follows recent market structure.
⚙️ Features
🔹 Auto-detects swing highs & lows using left/right bar pivots.
🔹 Adjustable Fibonacci levels for both Support and Resistance.
🔹 Adjustable smoothing length for smoother or more reactive lines.
🔹 Works across any timeframe and instrument.
🔹 Ideal for spotting potential reversal zones, trend continuation areas, and dynamic price support/resistance.
🧮 Default Settings
Fibonacci Level (Support) = 0.618
Fibonacci Level (Resistance) = 0.618
Left/Right Swing Bars = 5 / 5
Smoothing Length = 3
💡 Usage Tips
Combine these dynamic Fibonacci lines with trend indicators (EMA, RSI, or structure breaks) to confirm entries.
Increase Left/Right Swing Bars for stronger structural pivots on higher timeframes.
Change Fibonacci Levels (e.g., 0.382, 0.5, 0.786) to visualize multiple retracement zones.
Skrip jemputan sahaja
Hanya pengguna yang diluluskan oleh penulis boleh mengakses skrip ini. Anda perlu memohon dan mendapatkan kebenaran untuk menggunakannya. Ini selalunya diberikan selepas pembayaran. Untuk lebih butiran, ikuti arahan penulis di bawah atau hubungi terus ChartTechnical.
TradingView tidak menyarankan pembayaran untuk atau menggunakan skrip kecuali anda benar-benar mempercayai penulisnya dan memahami bagaimana ia berfungsi. Anda juga boleh mendapatkan alternatif sumber terbuka lain yang percuma dalam skrip komuniti kami.
Arahan penulis
Penafian
Skrip jemputan sahaja
Hanya pengguna yang diluluskan oleh penulis boleh mengakses skrip ini. Anda perlu memohon dan mendapatkan kebenaran untuk menggunakannya. Ini selalunya diberikan selepas pembayaran. Untuk lebih butiran, ikuti arahan penulis di bawah atau hubungi terus ChartTechnical.
TradingView tidak menyarankan pembayaran untuk atau menggunakan skrip kecuali anda benar-benar mempercayai penulisnya dan memahami bagaimana ia berfungsi. Anda juga boleh mendapatkan alternatif sumber terbuka lain yang percuma dalam skrip komuniti kami.