OPEN-SOURCE SCRIPT
BB - MFI/RSI [Modified from LazyBear]
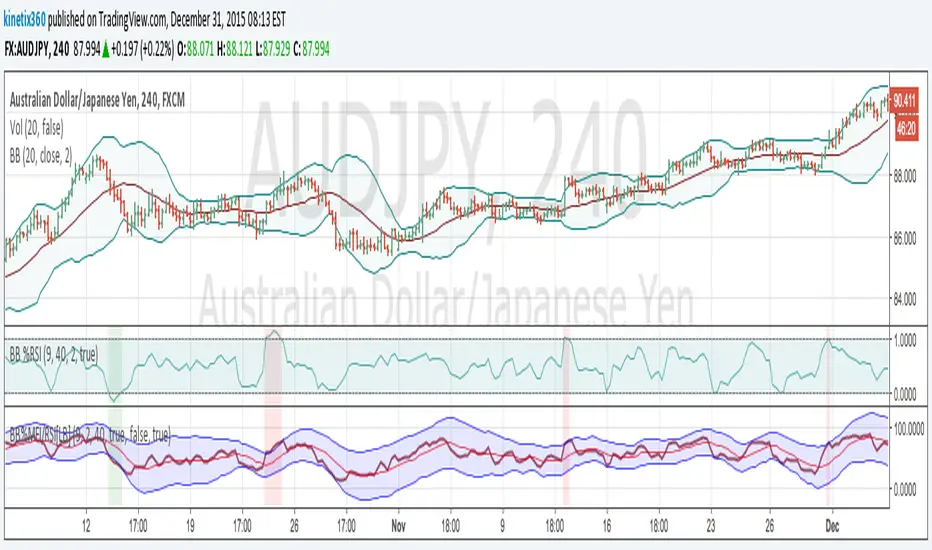
Here is the modification from BB-MFI/RSI from LazyBear. I add the period for the BB as told by John Bollinger in his book.
Base on his book, he suggest to try :
9p RSI with 40p BB and Stdv 2.0
14p RSI with 50p BB and Stdv 2.1
10p MFI with 40p BB and Stdv 2.0
The idea is to compare the short period in indicator with Long period of BB.
Base on his book, he suggest to try :
9p RSI with 40p BB and Stdv 2.0
14p RSI with 50p BB and Stdv 2.1
10p MFI with 40p BB and Stdv 2.0
The idea is to compare the short period in indicator with Long period of BB.
Skrip sumber terbuka
Dalam semangat sebenar TradingView, pencipta skrip ini telah menjadikannya sumber terbuka supaya pedagang dapat menilai dan mengesahkan kefungsiannya. Terima kasih kepada penulis! Walaupun anda boleh menggunakannya secara percuma, ingat bahawa menerbitkan semula kod ini adalah tertakluk kepada Peraturan Dalaman kami.
Penafian
Maklumat dan penerbitan adalah tidak dimaksudkan untuk menjadi, dan tidak membentuk, nasihat untuk kewangan, pelaburan, perdagangan dan jenis-jenis lain atau cadangan yang dibekalkan atau disahkan oleh TradingView. Baca dengan lebih lanjut di Terma Penggunaan.