PROTECTED SOURCE SCRIPT
Telah dikemas kini Fibonacci MA7
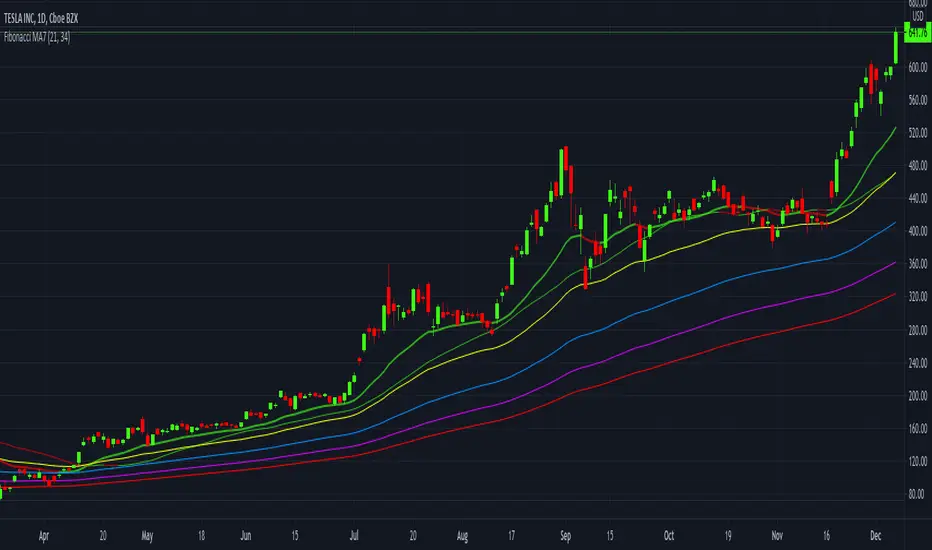
Fibonacci MA7 is a price indicator with 7 moving averages. It's inputs are based on the Fibonacci sequence 21, 34, 55, 89, 144, 233 & 377.
The tightest moving averages 21 & 34 are EMA ( exponential moving average ) & SMA ( simple moving average ) respectively. This helps give insight to the shortest time frame price action direction.
The next 5 are all EMA ( exponential moving average ) 55, 89, 144, 233 & 377 to help give a gradient of medium to long term price action history.
The colors can all be changed to your liking, but my color scheme is 21/34 green (red with a crossover), 55 blue , 89 white, 144 purple, 233 yellow, 377 red.
The most bullish pattern is when all colors are in a top down order of green, blue, white, purple, yellow, red. And the most bearish pattern is when all colors are in a bottom up order of green, blue, white, purple, yellow, red.
Also, a crossover, cross-under, divergence or convergence of these colors, help signal the future price action. For example, green crossing over other colors is heading bullish , green crossing under other colors is bearish .
Good luck and happy trading friends...
Nota Keluaran
MA source switched to high, low, close average instead of just close. Default color adjustments.Nota Keluaran
I updated MA input to high, low, close average, instead of just close. Adjustments to default colors.Nota Keluaran
I added another choice to click a checkbox in settings to use common moving averages 50, 100, 200 with another option to have them ema or sma. Good luck and happy trading friends...Nota Keluaran
input tweak = ohlc4Nota Keluaran
added MA150 to the common group choice of 50, 100, 200. still has toggle between ema or smaNota Keluaran
upgrade to version5add Fibonacci sequence #'s 610 & 987
Nota Keluaran
header updateNota Keluaran
7/17/23 update:Add VWMA (Volume Weighted Moving Average) options
Add VWAP (Anchored Volume Weighted Average Price) option
Skrip dilindungi
Skrip ini diterbitkan sebagai sumber tertutup. Akan tetapi, anda boleh menggunakannya secara bebas dan tanpa apa-apa had – ketahui lebih di sini.
Trading indicators:
tradingview.com/u/Options360/
tradingview.com/u/Options360/
Penafian
Maklumat dan penerbitan adalah tidak bertujuan, dan tidak membentuk, nasihat atau cadangan kewangan, pelaburan, dagangan atau jenis lain yang diberikan atau disahkan oleh TradingView. Baca lebih dalam Terma Penggunaan.