PROTECTED SOURCE SCRIPT
Daily GEX Zones & Dashboard by JC
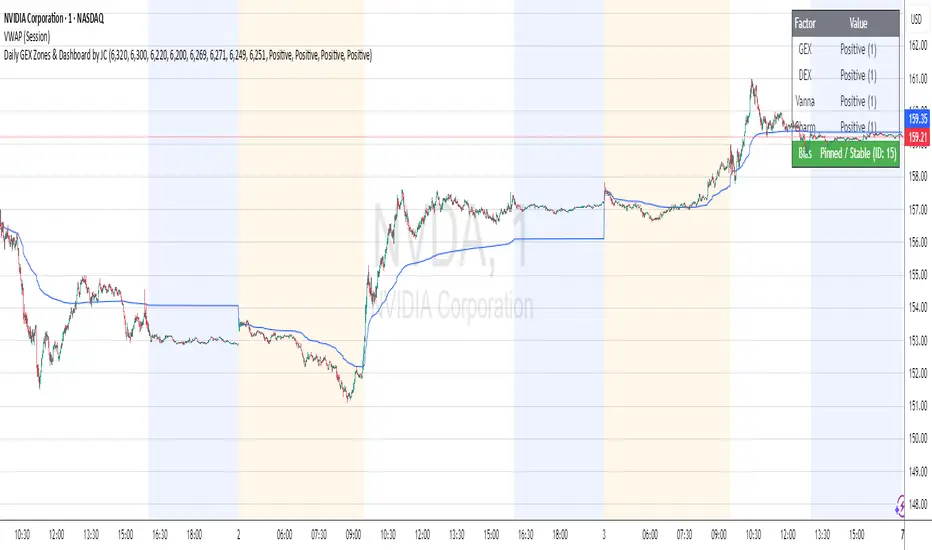
This script plots daily options-driven gamma zones alongside a live sentiment dashboard to help traders visualize dealer positioning, support/resistance clusters, and expected price behavior.
Features:
📅 Date-based GEX Zones: Automatically draws GEX Resistance, GEX Support, Max Pain Zone, and Zero Gamma Line for a specific trading day.
📊 Gamma Flow Dashboard: Displays real-time GEX, DEX, Vanna, and Charm flows using intuitive dropdowns (Negative, Neutral, Positive) — no manual number typing.
🔢 Combo ID Calculation: Combines your gamma flow selections into a single Combo ID, quantifying net positioning pressure.
🎯 Automatic Bias Classification: Instantly highlights whether the day’s gamma structure is likely Pinned/Stable, Unpinned/Wild, Choppy, or Trap/Expansion — color-coded for quick reading.
📈 Zero Gamma Lines: Plots two critical levels where gamma flips from long to short, providing valuable confluence for intraday support/resistance.
How to Use:
1️⃣ Pick your target date (e.g., current day) to activate the GEX boxes.
2️⃣ Enter the day’s Resistance Wall, Support Wall, Max Pain, and Zero Gamma levels from your option chain analysis.
3️⃣ Use the radio-style dropdowns to select sentiment for GEX, DEX, Vanna, and Charm based on your interpretation of open interest, hedging, dealer flow, and market structure.
4️⃣ The dashboard will auto-calculate your Combo ID and bias class.
Designed for:
SPX, SPY, QQQ, NVDA, or any high-liquidity underlying with active options flow.
Active day traders, gamma scalpers, and market makers tracking dealer positioning.
Tip:
Combine with price action levels, VWAP, and intraday structure for high probability trade zones.
Skrip dilindungi
Skrip ini diterbitkan sebagai sumber tertutup. Akan tetapi, anda boleh menggunakannya secara bebas dan tanpa apa-apa had – ketahui lebih di sini.
Penafian
Maklumat dan penerbitan adalah tidak bertujuan, dan tidak membentuk, nasihat atau cadangan kewangan, pelaburan, dagangan atau jenis lain yang diberikan atau disahkan oleh TradingView. Baca lebih dalam Terma Penggunaan.