Profitable Loser Model [MMT]Profitable Loser Model
Overview
The Profitable Loser Model is a powerful PineScript v6 indicator designed to enhance your trading by visualizing key price levels, session open zones, Fibonacci retracements, and premium/discount zones. This overlay indicator provides traders with a customizable toolkit to analyze market structure across any timeframe, making it ideal for intraday and swing trading strategies.
Features
Open Zone Visualization
- Plots a box based on the open and close of the first candle in a user-defined timeframe (default: 5-minute).
- Customizable box color, projection offset, and label size (Tiny, Small, Normal, Large).
- Displays a timeframe label (e.g., "5m Open Zone") for quick reference, toggleable on/off.
Session Open Lines
- Optionally draws horizontal lines at key session opens (8:30 AM, 9:30 AM, 1:30 PM, Midnight, New York time).
- Customize line color, style (Solid, Dashed, Dotted), width, and label size for each session.
- Perfect for identifying critical intraday price levels.
Premium and Discount Zones
- Highlights premium (above midpoint) and discount (below midpoint) zones based on session high/low.
- Toggleable with customizable colors and projection offsets.
- Helps traders spot overbought/oversold areas for potential mean-reversion trades.
Fibonacci Retracement Levels
- Plots user-defined Fibonacci levels (default: 0.23, 0.35, 0.5, 0.62, 0.705, 0.79, 0.886, 1, 1.1).
- Customizable line style, width, color, and labels (showing percentage and/or price).
- Dynamically adjusts based on price movement relative to the open zone.
Take Profit (TP) and Stop Loss (SL) Levels
- Highlights TP (default: 0.23) and SL (default: 1.1) Fibonacci levels with distinct colors.
- Fully customizable to align with your risk-reward strategy.
How It Works
- Session Detection : Resets daily (or per user-defined timeframe) to capture the first candle's open, high, low, and close.
- Open Zone : Draws a box between the open and close, extended forward by the projection offset.
- Session Lines : Plots lines at specified session opens with customizable styles and labels.
- Fibonacci Retracement : Adjusts levels dynamically based on session high/low and price action.
- Premium/Discount Zones : Calculated from the session range midpoint, updated in real-time.
Settings
- Open Zone :
- Timeframe (default: 5m), Calculate Timeframe (default: Daily).
- Toggle label, adjust size, box color, and projection offset.
- Session Open Lines :
- Enable/disable lines for 8:30 AM, 9:30 AM, 1:30 PM, Midnight.
- Customize color, style, width, label size, and vertical offset.
- Premium/Discount Zones :
- Toggle visibility, set colors, and adjust projection offset.
- Fibonacci Retracement :
- Toggle visibility, set custom levels, line style, width, color, and label options.
- Adjust projection offset.
- TP/SL :
- Set TP/SL Fibonacci levels and colors.
Use Cases
- Intraday Trading : Use session open lines and open zones to trade key market hours.
- Swing Trading : Leverage Fibonacci levels for potential reversal or continuation zones.
- Risk Management : Set precise TP/SL levels based on Fibonacci retracements.
- Market Structure : Identify overbought/oversold zones with premium/discount areas.
Notes
- Optimized with `dynamic_requests = true` for efficient real-time data handling.
- Visual elements (boxes, lines, labels) are cleaned up at the start of each new session.
- Session lines use New York time (`America/New_York`) for alignment with major markets.
Utiliti Pine

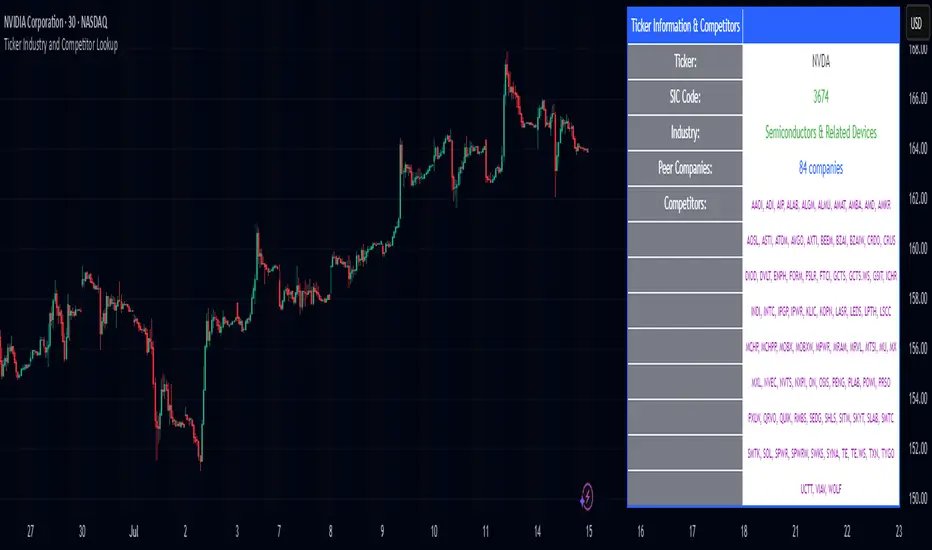
Ticker Industry and Competitor LookupThe Ticker Industry and Competitor Lookup is a comprehensive indicator that provides instant access to industry classification data and competitive intelligence for any ticker symbol. Built using the advanced SIC_TICKER_DATA library, this tool delivers professional-grade sector analysis with enterprise-level performance. It's a simple yet great tool for competitor research, sector studies, portfolio diversification, and investment decision-making.
This indicator is a simple tool built on based on our SIC_TICKER_DATA library to demonstrate the use cases of the library. In this case, you enter a ticker and it displays the sector, SIC or Standard Industrial Classification which is a SEC identifier, and more importantly, the competitors that are listed to be in the exact same SIC by SEC.
There isn't much to say about the indicator itself but we strongly recommend checking out the SIC_TICKER_DATA library we just published to learn more about the types of indicators you can build using it.
NEPALI DASHBOARD NEPALI DASHBORAD - All-In-One Sentiment Dashboard
Overview
The NEPALI DASHBORAD is a comprehensive, all-in-one dashboard designed to give day traders a quick yet powerful overview of market sentiment. Instead of cluttering your chart with dozens of individual indicators, this tool consolidates the signals from 11 different technical indicators into a single, easy-to-read table. It calculates an overall bull/bear sentiment score and provides a trading recommendation based on the confluence of these signals, helping you make more informed decisions at a glance.
The dashboard is fully customizable, allowing you to adjust indicator settings, change the table size, and move it to any corner of your chart.
Key Features
Multi-Indicator Analysis: Gathers data from 11 essential indicators covering trend, momentum, volume, and volatility.
Sentiment Score: Calculates a simple "Bull vs. Bear" score to instantly gauge market sentiment.
Actionable Recommendations: Provides a clear trading recommendation (Strong Buy, Buy, Sell, Strong Sell, Hold) based on the strength of the confluence.
Higher Timeframe (HTF) Context: Includes an HTF trend analysis to ensure your trades align with the bigger picture.
Customizable Dashboard: Easily change the size and position of the dashboard to fit your workspace.
How to Use
Check the Market Sentiment: Look at the "Bull vs. Bear" score first. A high score (e.g., 8 vs. 3) indicates strong confluence in one direction.
Verify the HTF Trend: Ensure your intended trade direction aligns with the higher timeframe trend for better probability. For example, be cautious about taking "SELL" signals if the HTF Trend is strongly "BULL."
Use the Recommendation as a Guide: The "Recommendation" and "Confidence" % give you a summary of the indicator signals. A "STRONG BUY" or "STRONG SELL" means that a significant majority of the indicators are in agreement.
Drill Down into Indicators: Use the individual indicator statuses in the table to understand why the market sentiment is bullish or bearish. For example, you might see that momentum indicators (RSI, Stoch) are bullish, but trend indicators (MA, MACD) are still lagging.
Combine with Your Strategy: This dashboard is a powerful confirmation tool. Use its signals to confirm entries and exits for your existing trading strategy. Do not use it as a standalone signal provider.
Disclaimer
In simple terms: This is a tool for analysis, not a signal to trade. Your money is your responsibility.
This script is for educational and informational purposes only. I am not a financial advisor; I am just a learner sharing my work. The information and tools provided are not, and should not be construed as, financial advice, an offer, or a solicitation to buy or sell any securities.
Trading and investing in financial markets involve substantial risk of loss and is not suitable for every investor. I do not guarantee the accuracy, completeness, or profitability of this script. All trading decisions you make are your own, and you are solely responsible for any resulting profits or losses.
Always conduct your own research and seek advice from a qualified financial advisor before making any investment decisions. By using this script, you agree that I am not liable for any and all losses you may incur.

AshishBediSPLThis tool, called "AshishBediSPL," is a special indicator for traders using TradingView. Its main purpose is to help you track and trade the combined price of a Call and a Put option at the same strike price, a strategy known as a Short Straddle.
What It Does:
Tracks Straddle Prices: You can select a specific Indian index or a stock like Reliance, choose a strike price and expiry date, and the indicator will show you the combined price of that Call and Put option as a single line on your chart.
Calculates Everything for You: You don't need to manually add the prices. The indicator automatically does the math to show you the total premium of the straddle.
Adds Trading Signals: You can turn on various popular trading tools (like VWAP, EMA, Supertrend, etc.). The indicator will then use these tools to automatically show "Buy" and "Sell" signals directly on the chart, helping you decide when to enter or exit a trade.
Customizable: You can choose which trading tools you want to use and adjust their settings to fit your personal trading style.
What is it Used For?
This indicator is specifically for traders who:
Trade a Short Straddle: This is a neutral options strategy where you expect the market to stay in a small range. The indicator helps you monitor the total premium you've collected.
Want to Simplify Analysis: Instead of looking at a Call chart and a Put chart separately, this tool combines them into one easy-to-read chart.
Use Technical Analysis: It helps you apply standard technical indicators directly to the combined premium price, giving you clear signals for your straddle trades.

Normalized Fibonacci Retracement (MTF/LOG)A question: Instead of creating indicators that constantly plot Fibonacci Retracement levels in a visually overwhelming way, why don't we redefine them on a different scale? 🤨
Overview
The Normalized Fibonacci Retracement indicator converts price data to a 0-100 scale based on the selected timeframe's high-low range, displaying normalized candlesticks alongside standard Fibonacci levels (23.6%, 38.2%, 50%, 61.8%, 78.6%). This normalization reveals patterns that may be hidden in absolute price charts and allows consistent analysis across different instruments.
Originality
By normalizing prices to percentages, this indicator enables pattern recognition independent of absolute price levels. The same formation at $10-$20 and $1000-$2000 appears identical on the normalized scale, helping traders identify recurring structures across various assets and timeframes.
Concepts
The indicator uses a simple formula to transform price data into percentages. This creates a bounded scale where patterns become comparable regardless of the underlying asset's price range. The normalized view often reveals symmetries and relationships not visible in traditional price charts.
Mechanics
The system tracks highs and lows within the selected timeframe as anchor points. When a new period begins, fresh boundaries are established and prices recalculated. Trend direction is determined by timing of extremes. Linear scaling uses direct percentage calculation, while logarithmic scaling applies exponential interpolation for assets with large percentage moves.
Functions
Timeframe Selection: Higher timeframe analysis on any chart resolution
Normalized Display: OHLC data converted to 0-100 percentage scale
Fibonacci Levels: Standard retracement levels plotted automatically
Scaling Options: Linear or logarithmic calculation methods
Pattern Recognition: Reveals formations hidden in absolute price charts
Moving Average: Optional 20-period SMA overlay
Notes
Ensure chart data covers the full selected timeframe for accurate calculations. Use logarithmic scaling for volatile assets with large percentage moves. The normalized scale is effective at revealing patterns and structures that remain consistent across different price ranges, making it particularly useful for comparative analysis and pattern-based trading strategies.
I hope it helps everyone. Do not forget to manage your risk. And trade as safely as possible. Best of luck!

SMA+Volume Buy AlertsOverview
This lightweight indicator combines trend and momentum filters to pinpoint high-conviction, oversold entries on ETFs or stocks. It plots your choice of two SMAs (default 100- & 200-day) and a 20-day volume moving average, then only flags a “BUY” when price crosses below an SMA and daily volume exceeds its average.
Use it to capture institutional-strength reversals without alert noise, and receive a single, clear signal exactly when market participants step in.
Key Features
Dual SMA Trend Lines (100/200-day by default)
Volume Filter (20-day avg): only overshoots on above-average volume signal
One-Shot Buy Markers: triangles appear beneath the precise bar that crosses under your SMA on high volume
Alert Conditions: “Buy 100 SMA + High Vol” and “Buy 200 SMA + High Vol” ready for desktop, mobile, or webhooks
Show/Hide Toggle for your SMA lines
100% Pine v6, optimized for speed and compatibility
Inputs
Short SMA Length (default 100)
Long SMA Length (default 200)
Volume MA Length (default 20)
Show SMA Lines toggle
How to Use
Add to Chart: Copy & paste this script into TradingView’s Pine editor, then Save & Add to Chart.
Configure Inputs: Adjust SMA and volume-MA lengths to your trading style.
Create Alerts:
Open “Create Alert,” select the “SMA-VOL-BUY” indicator.
Choose “Buy 100 SMA + High Vol” or “Buy 200 SMA + High Vol.”
Set trigger to “Once Per Bar Close.”
Trade with Confidence: Only the most significant, high-volume overshoots get flagged—no spam, just high-quality setups.
Best Practices
Frame Alignment: Combine daily signals with a weekly SMA trend filter for multi-timeframe confirmation.
Volume Context: Ensure that “high” volume truly represents above-average activity in your chosen security.
Risk Management: Use the signal bar’s low as your stop, and size positions to match your risk tolerance.
Review & Iterate: Tweak SMA or volume lengths to suit fast-moving sectors (e.g. 50/100 SMAs) or slower large-caps.

SMA Undervalue Buy AlertsSMA Undervalue Buy Alerts
Free, open-source Pine v6 indicator for spotting undervalued ETF/stock entries
This simple yet powerful indicator plots two user-configurable Simple Moving Averages (default 100- and 200-day) on your chart and automatically marks any bar where price closes below those SMAs with an on-chart “BUY” triangle. It’s ideal for ETF traders who want a systematic, price-action-based signal whenever a major trend filter is breached to the downside—often a sign of short-term overselling in an otherwise up-trending market.
Key Features
Dual SMA Lines (default 100/200): Smooth out noise and highlight medium- and long-term trend backdrops
Automatic Buy Markers: Triangles appear beneath any candle that closes under your chosen SMA, so you never miss an overshoot
Built-in Alert Conditions: Four alert hooks—“Buy 100 SMA” and “Buy 200 SMA”—let you receive desktop, mobile or webhook notifications the moment a close beneath your SMAs occurs
Show/Hide Toggle: Quickly turn the SMA lines on or off without removing the script
100% Pine v6: Fast, lightweight, and compatible with all TradingView chart types
How to Use
Add to Chart: Copy & paste the Pine v6 code into TradingView’s Pine editor, then Save & Add to Chart.
Configure Inputs: Adjust “Short SMA Length” and “Long SMA Length” to your preferred look-back periods (e.g. 50/200, 20/50, etc.).
Create Alerts: In the Create Alert dialog, choose your indicator, then select “Buy 100 SMA” or “Buy 200 SMA” under Series. Set it to “Once Per Bar Close” for reliable signals.
Trade Management: Use the buy markers as entry triggers or confirm with volume, RSI, or other confluence tools before committing.
Best Practices
Trend Confirmation: Combine with a higher-TF trend filter (e.g. 200 SMA on weekly) to stay aligned with the broader market
Volume Check: Look for above-average volume on overshoot candles to validate institutional interest
Risk Control: Always define your stop (e.g. below the low of the signal bar) and position-size responsibly

UT Bot Strategy with EMA Trend FilterUT Bot Strategy with EMA 20/50/100/200 acting as a trend filter.

Sector SPDR ETFsThis script automatically identifies the SPDR sector ETF that corresponds to the currently viewed US stock ticker. It maps over 500 US-listed stocks to their respective SPDR sector ETFs — such as XLK (Technology), XLF (Financials), XLY (Consumer Discretionary), and others — based on pre-defined symbol lists.
When applied to a chart, the script displays a label below the last candle showing the SPDR sector symbol (e.g., "XLE" for Energy stocks like XOM). This allows traders and investors to quickly understand the sector classification of any stock they analyze.
Key Features:
Maps tickers to SPDR sector ETFs: XLC, XLY, XLP, XLE, XLF, XLV, XLI, XLB, XLRE, XLK, and XLU.
Displays the corresponding sector label on the chart.
Helpful for sector rotation strategies, macro analysis, or thematic investing.

Scalping Candle [Crak x MMT]The Scalping Candle is a TradingView indicator designed for scalping strategies, identifying potential bullish and bearish engulfing patterns on price charts. It overlays directly on the chart and marks specific candle patterns with visual signals, helping traders spot short-term trading opportunities. The indicator includes a customizable bias filter to focus on bullish, bearish, or neutral market conditions.
Features
Overlay Indicator : Displays bullish and bearish signals directly on the price chart.
Bias Filter : Allows users to select a market bias ('Bullish', 'Bearish', or 'Neutral') to filter signals based on their trading preference.
Visual Signals : Plots green upward triangles below bullish candles and red downward triangles above bearish candles.
Alerts : Generates alerts for bullish and bearish engulfing patterns, enabling timely notifications for trade setups.
How It Works
The indicator analyzes the relationship between the current and previous candles to detect engulfing patterns:
Bullish Engulfing : Triggered when the current candle's low is at or below the previous candle's low, and its close is at or above the previous candle's midpoint. This signal is displayed only if the bias filter is set to 'Neutral' or 'Bullish'.
Bearish Engulfing : Triggered when the current candle's high is at or above the previous candle's high, and its close is at or below the previous candle's midpoint. This signal is displayed only if the bias filter is set to 'Neutral' or 'Bearish'.
The previous candle's midpoint is calculated as the average of its high and low prices.
Usage
- Add to Chart : Apply the indicator to any TradingView chart.
- Configure Bias Filter :
Neutral : Displays both bullish and bearish signals.
Bullish : Displays only bullish signals.
Bearish : Displays only bearish signals.
- Interpret Signals :
Green upward triangle below a candle indicates a potential bullish reversal.
Red downward triangle above a candle indicates a potential bearish reversal.
- Set Alerts : Use the built-in alert conditions to receive notifications when bullish or bearish engulfing patterns are detected.
Settings
Bias Filter : Choose between 'Neutral', 'Bullish', or 'Bearish' to control which signals are displayed.
Shape Size : Signals are plotted as small triangles for minimal chart clutter.
Alert Conditions : Enable alerts for 'Bullish Engulfing Detected' or 'Bearish Engulfing Detected' to stay informed of new signals.
Ideal Use Case
This indicator is tailored for scalpers and short-term traders looking to capitalize on quick price movements driven by engulfing candle patterns. It works best on 15-minute chart and can be combined with other technical tools for confirmation.

Rob Hoffman IRB Strategy by SniffDog30 Min Bonk Strategy. Not sure if this is beneficial for other tokens/coins. Use at you own risk.
Good strategy for starter in Rob Hoffman style of indicators.
NOTE:
1) Switch to 30 mins
2) adjust to your exchange and quantity of trade

Bull/Bear Power Strength AlertThis is under construction. Once it is fully complete I will post it in description

YAS V1Use on chart
6
80
This advanced "All-in-One" indicator combines the most powerful smart money concepts (SMC), order blocks (OB), fair value gaps (FVG), support & resistance (SR), and liquidity voids, along with entry signals based on EMA and RSI filters.
💡 Key Features:
✅ Order Blocks (OB):
Highlights potential bullish and bearish order blocks to identify strong institutional zones where price might reverse.
✅ Fair Value Gaps (FVG):
Marks price gaps that indicate imbalance and possible zones for retracement or continuation.
✅ Support & Resistance (SR):
Automatically plots dynamic support and resistance levels using pivots, helping you to spot key reaction areas.
✅ Liquidity Voids:
Visualizes potential liquidity gaps or low-volume areas that can act as price magnets.
✅ Buy & Sell Signals:
Generates dynamic BUY and SELL signals based on a combination of EMA trend filters and RSI overbought/oversold levels.
✅ Fully Configurable:
Choose which features to display (OB, FVG, SR, Liquidity Voids, signals).
Adjust EMA and RSI settings to match your strategy.
Control the number of signals (reduce or increase) using a signal sensitivity filter.
⚙️ How it Works:
Trend Filter (EMA):
Price above EMA confirms a bullish environment, below EMA confirms bearish.
RSI Filter:
Signals are validated with RSI to avoid overtrading in ranging markets.
Zones & Gaps:
Institutional concepts (order blocks, gaps) help traders understand supply/demand and price inefficiencies.
🎯 Usage:
Perfect for:
Scalpers looking for intraday turning points.
Swing traders spotting high-probability levels.
Anyone interested in smart money concepts.
🚨 Alerts:
Includes built-in alerts for both BUY and SELL signals so you can react instantly without watching the screen all the time.
💬 Note:
This is a beta version designed to be improved with community feedback. Use it as a guide, and always confirm signals with your own analysis and risk management.
🔥 Ready to take your trading to the next level? Add this indicator to your chart, customize the settings, and start seeing the market like smart money!

YAS V1This advanced "All-in-One" indicator combines the most powerful smart money concepts (SMC), order blocks (OB), fair value gaps (FVG), support & resistance (SR), and liquidity voids, along with entry signals based on EMA and RSI filters.
💡 Key Features:
✅ Order Blocks (OB):
Highlights potential bullish and bearish order blocks to identify strong institutional zones where price might reverse.
✅ Fair Value Gaps (FVG):
Marks price gaps that indicate imbalance and possible zones for retracement or continuation.
✅ Support & Resistance (SR):
Automatically plots dynamic support and resistance levels using pivots, helping you to spot key reaction areas.
✅ Liquidity Voids:
Visualizes potential liquidity gaps or low-volume areas that can act as price magnets.
✅ Buy & Sell Signals:
Generates dynamic BUY and SELL signals based on a combination of EMA trend filters and RSI overbought/oversold levels.
✅ Fully Configurable:
Choose which features to display (OB, FVG, SR, Liquidity Voids, signals).
Adjust EMA and RSI settings to match your strategy.
Control the number of signals (reduce or increase) using a signal sensitivity filter.
⚙️ How it Works:
Trend Filter (EMA):
Price above EMA confirms a bullish environment, below EMA confirms bearish.
RSI Filter:
Signals are validated with RSI to avoid overtrading in ranging markets.
Zones & Gaps:
Institutional concepts (order blocks, gaps) help traders understand supply/demand and price inefficiencies.
🎯 Usage:
Perfect for:
Scalpers looking for intraday turning points.
Swing traders spotting high-probability levels.
Anyone interested in smart money concepts.
🚨 Alerts:
Includes built-in alerts for both BUY and SELL signals so you can react instantly without watching the screen all the time.
💬 Note:
This is a beta version designed to be improved with community feedback. Use it as a guide, and always confirm signals with your own analysis and risk management.
🔥 Ready to take your trading to the next level? Add this indicator to your chart, customize the settings, and start seeing the market like smart money!

YAS GROUPThis script is a powerful combination of Order Blocks (OB), market structure, and liquidity levels. It helps traders easily identify high-probability areas for entries and exits, detect trend shifts (BOS & CHoCH), and highlight strong support/resistance zones. The script is designed for both scalping and swing trading, offering flexibility and precision. Users can adjust OB sensitivity, show or hide structure labels, and customize visual settings to match their style. Alerts are also included for key signals. Perfect for traders looking to read the market like smart money.

Asian/London Session High/LowMarks out previous Asian session and current London session highs/lows.

SuperPerformance_V1.2📊 SUPER PERFORMANCE INDICATOR
A comprehensive performance analysis tool that compares your stock against selected indices and tracks sector performance across multiple timeframes.
🎯 MAIN FEATURES
✅ Stock Performance Table
• Compares stock vs index performance across 1D, 5D, 10D, 20D, 50D, 200D periods
• Shows ✓/✗ indicators for outperformance tracking
• Displays percentage gains/losses with color coding (green=positive, red=negative)
• Calculates conviction score based on outperformance across timeframes
• Provides performance difference between stock and index
✅ Sector Performance Table
• Ranks top 5 performing sectors across different timeframes
• Shows real-time sector performance with percentage changes
• Tracks 19 major Indian market sectors
• Customizable time periods (1D, 5D, 10D, 20D, 60D)
✅ Sector Display Box
• Shows current stock's sector classification
• Customizable positioning and styling
• Optional sector abbreviations
🔧 CUSTOMIZATION OPTIONS
📋 Display Settings
• Dark/Light mode toggle
• Show/hide individual tables
• Mini mode for compact view
• Index selection (default: NIFTYMIDSML400)
📊 Table Controls
• Enable/disable specific columns and rows
• Adjustable table size (tiny/small/normal/large)
• 9 positioning options for each table
• Color customization for backgrounds and text
🎨 Advanced Features
• Conviction scoring system (Perfect/Solid/Good/Ok/Weak/Poor)
• Real-time performance tracking
• Multi-timeframe analysis
• Sector rotation insights
📈 CONVICTION LEVELS
• Perfect: Outperforms in all periods
• Solid: Outperforms in 67%+ periods
• Good: Outperforms in 50%+ periods
• Ok: Outperforms in 33%+ periods
• Weak: Outperforms in some periods
• Poor: Underperforms in all periods
⚙️ HOW TO USE
1. Add indicator to your chart
2. Select comparison index in Display Settings
3. Customize visible columns/rows as needed
4. Position tables on screen
5. Analyze green ✓ (outperforming) vs red ✗ (underperforming)
6. Use conviction score for overall performance assessment
🎯 IDEAL FOR
• Relative strength analysis
• Sector rotation strategies
• Performance benchmarking
• Indian equity markets
Note: Designed specifically for NSE/Indian market analysis with pre-configured sector indices.

Daily 10-ATR & %ATR (Top Right)Better version to be able to see ATR and the percentage it has moved at a glance, no charting just the numbers

EMAs + LSMA Cross Alert (Mejorado)his indicator is designed to identify buy and sell signals based on the behavior of multiple exponential moving averages (EMAs) and a Least Squares Moving Average (LSMA). It includes 5 EMAs and one LSMA, with visual and alert features.
📌 Components:
EMA 4 (purple)
EMA 9 (Fuchsia)
EMA 21 (blue)
EMA 50 (Green)
EMA 200 (maroon)
LSMA 30 (Orange)
🔍 Signal Logic:
✅ Buy Signal:
The LSMA (30) must be below both EMA 4 and EMA 9.
A bullish crossover occurs: EMA 4 crosses above EMA 9.
Only one signal is triggered per crossover, avoiding repeated alerts during trend continuation.
❌ Sell Signal:
The LSMA (30) must be above both EMA 4 and EMA 9.
A bearish crossover occurs: EMA 4 crosses below EMA 9.
Only one signal is triggered per crossover, avoiding repeated alerts during trend continuation.
🖥️ Visual Features:
Option to show/hide each EMA and the LSMA.
Buy/Sell markers appear at cross points.
A white background highlight marks the candle where the signal occurs (optional).
Visuals scale dynamically with the chart zoom and axes.
🔔 Alerts:
Custom alert conditions for Buy and Sell.
Alerts can trigger push notifications to the TradingView mobile app, email, or webhook.
Configured to avoid repeating alerts unless the trend resets and a new valid crossover occurs.

ATR Label (Top Right)Final version easier to run daily ATR first, then move to lower time frames, only purpose is to see the ATR quick


