OPEN-SOURCE SCRIPT
ATH & ATL Distances PRO
Indicator Description:
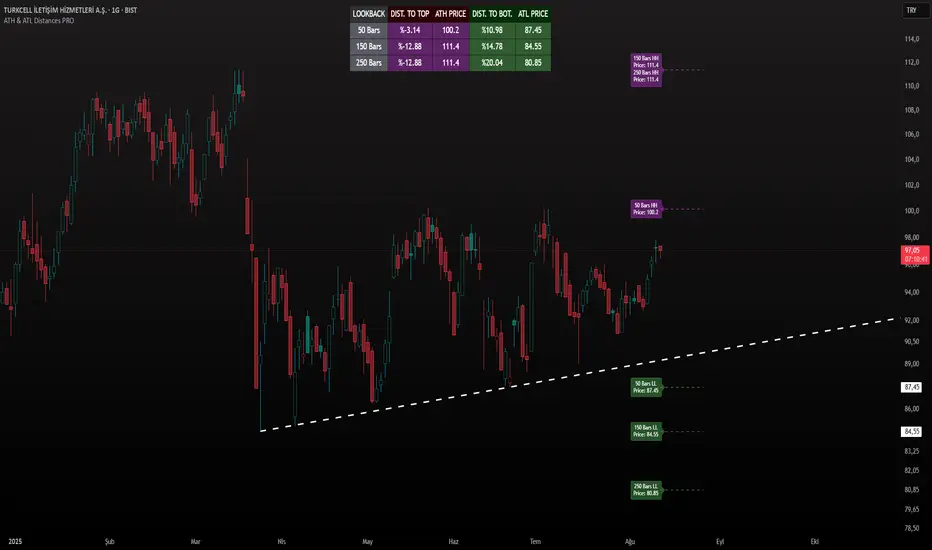
ATH & ATL Distances PROThis Pine Script indicator, built on version 6, helps traders visualize and monitor the percentage distances from the current closing price to the rolling All-Time High (ATH) and All-Time Low (ATL) over customizable lookback periods.
It's designed for overlay on your TradingView charts, providing a clear table display and optional horizontal lines with labels for quick reference.
This tool is ideal for assessing market pullbacks, rallies, or potential reversal points based on recent price extremes.
Key Features:
Customizable Lookbacks: Three adjustable periods (default: 50, 150, 250 bars) to calculate short-, medium-, and long-term highs/lows.
Percentage Distances: Shows how far the current price is from ATH (negative percentage if below) and ATL (positive if above).
Visual Aids: Optional dashed lines for ATH/ATL levels extending a set number of bars, with grouped labels to avoid clutter if levels overlap.
Info Table: A persistent table summarizing lookbacks, distances, and prices, with color-coded cells for easy reading (red for ATH/dist to top, green for ATL/dist to bottom).
User Controls: Toggle rows, lines, table position, and colors via inputs for a personalized experience.
How It Works (Logic Explained):
The script uses TradingView's built-in functions like ta.highest() and ta.lowest() to find the highest high and lowest low within each lookback period (capped at available bars to handle early chart data). It then computes:Distance to ATH: ((close - ATH) / ATH) * 100 – Negative values indicate the price is below the high.
Distance to ATL: ((close - ATL) / ATL) * 100 – Positive values show the price is above the low.
Unique ATH/ATL prices across lookbacks are grouped into arrays to prevent duplicate lines/labels; if prices match, labels concatenate details (e.g., "50 Bars HH\n150 Bars HH").
Drawings (lines and labels) are efficiently managed by redrawing only on the latest bar to optimize performance. The table updates in real-time on every bar close.How to Use:Add the indicator to your chart via TradingView's "Indicators" menu (search for "ATH & ATL Distances PRO").
Customize inputs:
Adjust lookback periods (1-1000 bars) for your timeframe (e.g., shorter for intraday, longer for daily/weekly).
Enable/disable lines, rows, or change colors/table position to suit your setup.
Interpret the table:
"DIST. TO TOP" (red): Percentage drop needed to reach ATH – useful for spotting overbought conditions.
"DIST. TO BOT." (green): Percentage rise from ATL – helpful for identifying support levels.
If lines are enabled, hover over labels for details on which lookbacks share the level.
Best on any symbol/timeframe; combine with other indicators like RSI or moving averages for confluence.
This script is open-source and free to use/modify. No external dependencies – it runs natively on TradingView. Feedback welcome; if you find it useful, a like or comment helps!
Skrip sumber terbuka
Dalam semangat TradingView sebenar, pencipta skrip ini telah menjadikannya sumber terbuka, jadi pedagang boleh menilai dan mengesahkan kefungsiannya. Terima kasih kepada penulis! Walaupuan anda boleh menggunakan secara percuma, ingat bahawa penerbitan semula kod ini tertakluk kepada Peraturan Dalaman.
Penafian
Maklumat dan penerbitan adalah tidak bertujuan, dan tidak membentuk, nasihat atau cadangan kewangan, pelaburan, dagangan atau jenis lain yang diberikan atau disahkan oleh TradingView. Baca lebih dalam Terma Penggunaan.