OPEN-SOURCE SCRIPT
ATR% Multiple From MA - Overextensions tracking
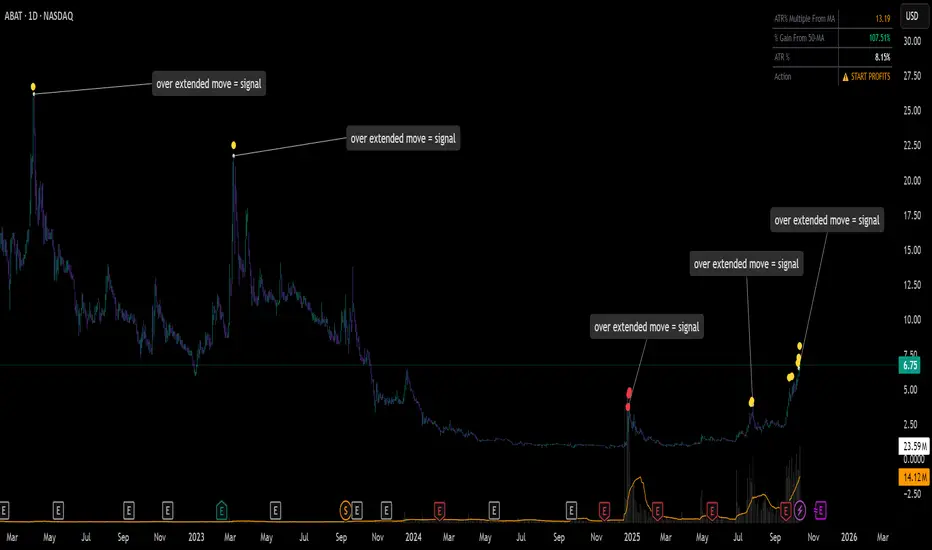
ATR% Multiple From MA - Quantifiable Profit Taking Indicator
This overlay indicator identifies overextended price moves by calculating how many ATR% multiples price is away from a moving average, providing objective profit-taking signals.
Formula:
A = ATR% = (ATR / Price) × 100
B = % Gain from MA = ((Price - MA) / MA) × 100
ATR% Multiple = B / A
Signals:
Yellow circle at 7x: Start scaling out partial profits
Red circle at 10x+: Heavily overextended, aggressive profit taking recommended
Stats table: Real-time ATR% Multiple, % Gain from MA, ATR%, and action status
For very volatile markets I usually go for 10x and 15x extension instead of 7x and 10x.
This method normalizes moves across different volatility environments, eliminating emotional decision-making. Historical examples include PLTR, SOFI, TSLA, NVDA which stalled after exceeding 10x.
Customizable Settings:
ATR Length (default: 14)
MA Length (default: 50)
Profit Zone thresholds (7x, 10x)
Toggle circles and MA display
Skrip sumber terbuka
Dalam semangat TradingView sebenar, pencipta skrip ini telah menjadikannya sumber terbuka, jadi pedagang boleh menilai dan mengesahkan kefungsiannya. Terima kasih kepada penulis! Walaupuan anda boleh menggunakan secara percuma, ingat bahawa penerbitan semula kod ini tertakluk kepada Peraturan Dalaman.
Penafian
Maklumat dan penerbitan adalah tidak bertujuan, dan tidak membentuk, nasihat atau cadangan kewangan, pelaburan, dagangan atau jenis lain yang diberikan atau disahkan oleh TradingView. Baca lebih dalam Terma Penggunaan.