OPEN-SOURCE SCRIPT
Telah dikemas kini Return (Percent Change)
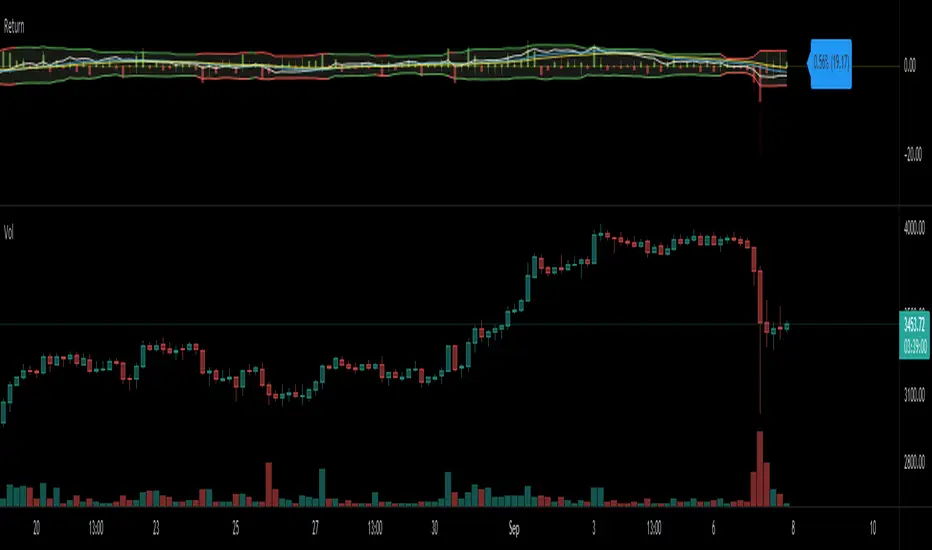
This Script displays Regular or Log Returns as either a line or histogram and labels the current bar.
If something other than price is selected as the source, the result is percent change with a positive or negative slope.
If a moving average of price is used as the source, the result is analogous to a strength index
Other options include a look-back period adjustment (the default is 1),
smoothing results by converting to an EMA, and
Bollinger Bands with Length and Standard Deviation inputs.
Nota Keluaran
Name Shortened to "Return"Nota Keluaran
precision increased to two decimal placesNota Keluaran
// This Script displays Regular or Log Returns as either a line or histogram and labels the current bar. // Additionally, an "ArcTan" method is available which allows the slope of a line that crosses zero to be displayed.
// If a moving average of price is used as the source, the result is analogous to a strength index
// Other options include smoothing by converting to an EMA of returns,
// Bollinger Bands with SMA for the Length, and Standard Deviation for the Width.
// When the BB Basis is positive the bands appear green, and when negative they are red.
// if you set the BB basis to one, the color of the BB histogram will indicate the slope only.
Nota Keluaran
Two Decimal Places for Absolute Change LabelNota Keluaran
corrected log input type spellingNota Keluaran
...Nota Keluaran
Option to display absolute values was added.Bollinger Bands can be toggled on/off.
Nota Keluaran
Script has been updated to allow Return and Basis to be expressed as several different types of moving average. From the Pinescript Reference:sma: The sma function returns the moving average, that is the sum of last y values of x, divided by y.
ema: The ema function returns the exponentially weighted moving average. In ema weighting factors decrease exponentially. It calculates by using a formula: EMA = alpha * x + (1 - alpha) * EMA[1], where alpha = 2 / (y + 1)
wma: The wma function returns weighted moving average of x for y bars back. In wma weighting factors decrease in arithmetical progression.
rma: Moving average used in RSI. It is the exponentially weighted moving average with alpha = 1 / length.
swma: Symmetrically weighted moving average with fixed length: 4. Weights: [1/6, 2/6, 2/6, 1/6].
vwma: The vwma function returns volume-weighted moving average of x for y bars back. It is the same as: sma(x * volume, y) / sma(volume, y)
Bands may be displayed as:
std dev: Standard Deviation (typical multiple value=2)
atr: Average True Range (typical multiple value = 1) RMA of true range. True range is max(high - low, abs(high - close[1]), abs(low - close[1]))
Here's an example show Bi-Weekly Log Returns of the entire history of bitcoin:
Here's an example of Daily Reg Returns in Absolute Price and the indicator being used to show the 30SMA Slope:
Nota Keluaran
Comments and Example updatedCorrected example of Daily Reg Returns in Absolute Price and the indicator being used to show the 30SMA Slope:
Nota Keluaran
Added functionality to magnify basis line (display only)Nota Keluaran
corrected idea imageNota Keluaran
formattingNota Keluaran
corrected versioningNota Keluaran
formattingNota Keluaran
Script has been updated to include wicks, so you can now see candles normalized to zero.Two EMA's of the basis also have been added as an option, as well as the ability to magnify the plots (display only).
Skrip sumber terbuka
Dalam semangat TradingView sebenar, pencipta skrip ini telah menjadikannya sumber terbuka, jadi pedagang boleh menilai dan mengesahkan kefungsiannya. Terima kasih kepada penulis! Walaupuan anda boleh menggunakan secara percuma, ingat bahawa penerbitan semula kod ini tertakluk kepada Peraturan Dalaman.
Penafian
Maklumat dan penerbitan adalah tidak bertujuan, dan tidak membentuk, nasihat atau cadangan kewangan, pelaburan, dagangan atau jenis lain yang diberikan atau disahkan oleh TradingView. Baca lebih dalam Terma Penggunaan.