OPEN-SOURCE SCRIPT
Buy and hold visualiser
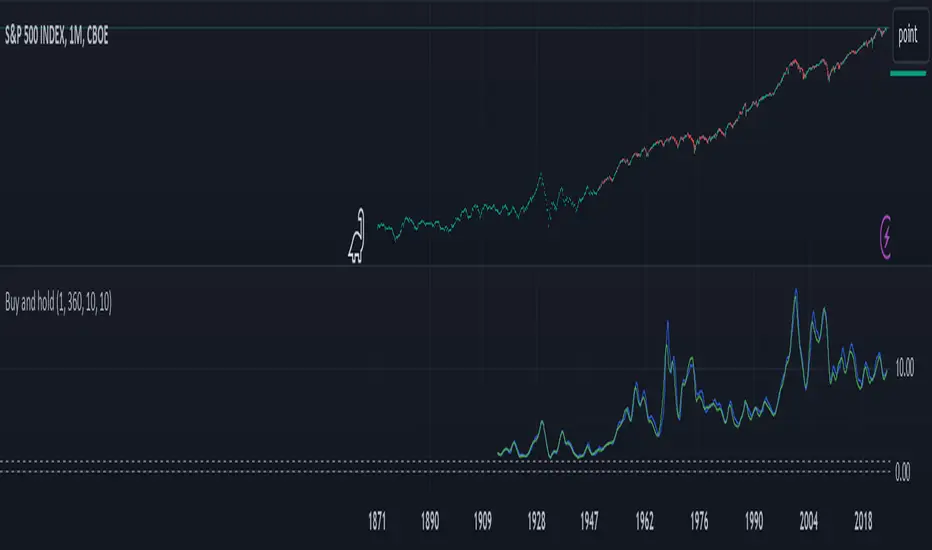
This indicator shows the historical performance of a buy and hold portfolio. The purpose of the indicator is to show
1. the effect of the hold time (time between buying and selling a number of instruments) and
2. the effect of investing all capital at once (lump sum) versus dividing the investment over a number of months or years (cost averaging).
The indicator shows four lines:
- a dotted line at 0 (dollar or any other currency),
- a dotted line at the level of initial investment,
- a blue line that shows the amount of capital after selling at the end of the investment period after a lump sum investment,
- a green line that shows the amount of capital after selling at the end of the investment period after an investment that was done in chunks (cost averaging)
When 'chunks' is set to 1, the green line will match the blue line.
When 'investment' is set to 1, the blue and green lines will show the factor by which the initial investment was multiplied at the end of the investment period.
The effect of the hold time can be easily seen in the following example: Choose SPX (CBOE) as the active instrument, set 'chunks' to 1 and 'months' to 12. Depending on when you bought your portfolio, selling it a year later is like tossing a coin. Set 'months' to 360 and it becomes clear that it doesn't matter when you buy, the value of your portfolio will likely multiply considerably in 30 years, even if you bought everything all at once just before a bear market. It shows that with a long time horizon, you don't have to worry about timing the market.
Continue the example above and set 'chunks' to 12, thus spreading the initial investment over 12 months. The green line shows the cost averaging performance. The blue lump sum line is above the green line most of the time. Increase the chunks to 60 and the difference increases.
Skrip sumber terbuka
Dalam semangat sebenar TradingView, pencipta skrip ini telah menjadikannya sumber terbuka supaya pedagang dapat menilai dan mengesahkan kefungsiannya. Terima kasih kepada penulis! Walaupun anda boleh menggunakannya secara percuma, ingat bahawa menerbitkan semula kod ini adalah tertakluk kepada Peraturan Dalaman kami.
Penafian
Maklumat dan penerbitan adalah tidak dimaksudkan untuk menjadi, dan tidak membentuk, nasihat untuk kewangan, pelaburan, perdagangan dan jenis-jenis lain atau cadangan yang dibekalkan atau disahkan oleh TradingView. Baca dengan lebih lanjut di Terma Penggunaan.