The Multi Touch Confluence Indicator Subplot
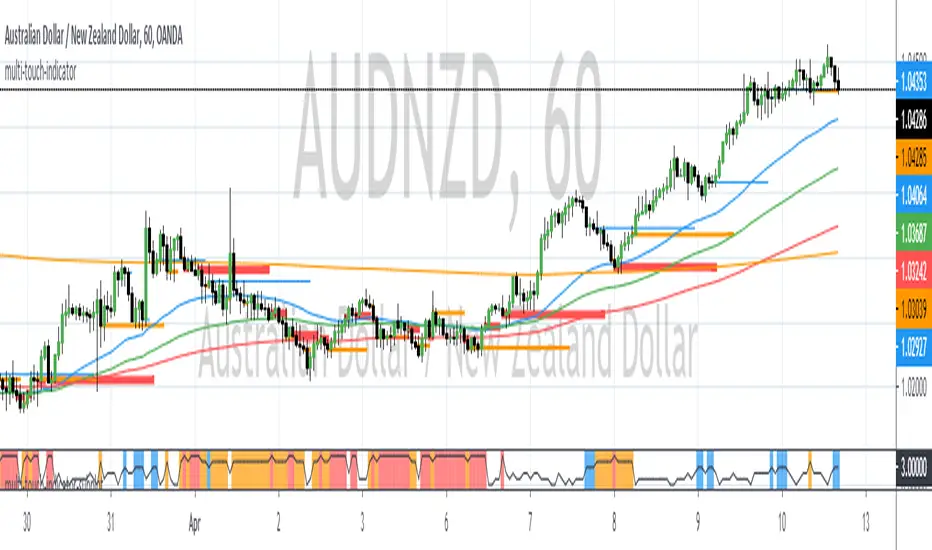
The confluence zone is specified as a point difference.
When confluence is found, the indicator will paint vertical lines of different color and width.
- Blue Zones indicate a confluence of 3 EMAs across all time frames
- Orange Zones indicate a confluence of 4 EMAs across all time frames
- Red Zones indicate a confluence of 5 or more EMAs across all time frames.
The maximum number of time frames being used is 6.
The maximum number of EMAs per time frame is 4.
When confluence occurs it usually indicates a precursor of price expansion. This indicator can be used to determine when momentum is about to come back into the market.
Skrip jemputan sahaja
Hanya pengguna disahkan oleh penulis boleh mengakses skrip ini. Anda perlu memohon dan mendapatkan kebenaran untuk menggunakannya. Keizinan selalunya diberikan selepas pembayaran. Untuk lebih butiran, ikuti arahan penulis di bawah atau hubungi LiquidityTracker secara terus.
TradingView TIDAK menyarankan pembayaran atau penggunaan skrip kecuali anda mempercayai sepenuhnya penulis dan memahami bagaimana ia berfungsi. Anda juga boleh menjumpai alternatif sumber terbuka dan percuma yang lain di dalam skrip komuniti kami.
Arahan penulis
Penafian
Skrip jemputan sahaja
Hanya pengguna disahkan oleh penulis boleh mengakses skrip ini. Anda perlu memohon dan mendapatkan kebenaran untuk menggunakannya. Keizinan selalunya diberikan selepas pembayaran. Untuk lebih butiran, ikuti arahan penulis di bawah atau hubungi LiquidityTracker secara terus.
TradingView TIDAK menyarankan pembayaran atau penggunaan skrip kecuali anda mempercayai sepenuhnya penulis dan memahami bagaimana ia berfungsi. Anda juga boleh menjumpai alternatif sumber terbuka dan percuma yang lain di dalam skrip komuniti kami.