Cash The System Trend Indicator (STRATEGY)
If the 10SMA on the 30min chart is trading over the 50sma, then the market is bullish . If the 10SMA is trading under the 50SMA on the 30min chart, then the market is bearish .
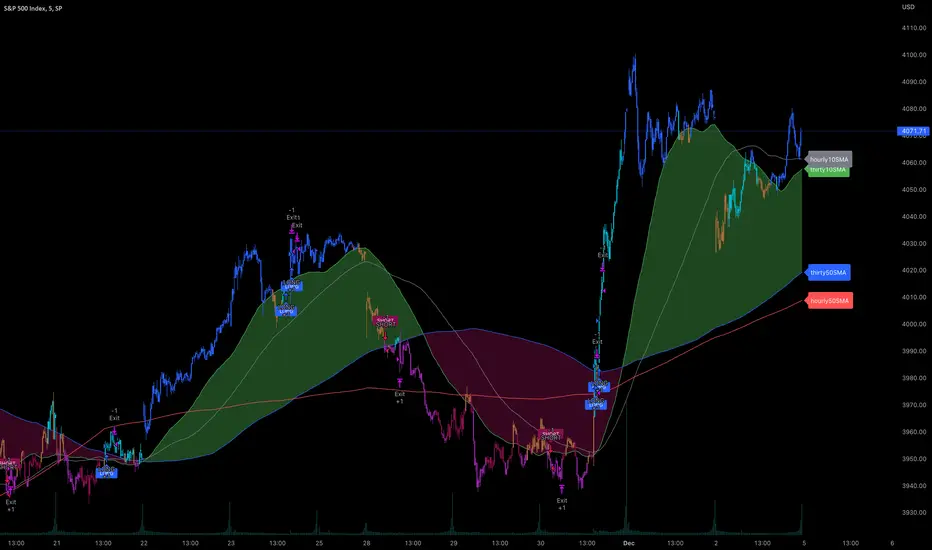
This Indicator colors the candles based on what The System is currently telling us.
Blue = Strong Bullish - SPX/Ticker is trading above the 10 SMA and the 10 SMA > 50 SMA giving a BUY signal.
Aqua = Mild Bullish - SPX/Ticker is trading above the 50 SMA , but we do not have a BUY signal yet. MACD is bullish.
Amber = Uncertainty in the market. SPX/Ticker is in a chop zone, and trades in this area are high risk.
Pink = Mild Bearish - SPX/Ticker is trading below the 50 SMA , but we do not have a SELL signal yet. MACD is bearish.
Purple = Strong Bearish - SPX/Ticker is trading below the 10 SMA , and the 10 SMA < 50 SMA giving a SELL signal.
Along with the colored candlesticks , the indicator will signal when to go LONG or SHORT based on when the trend direction changes.
While The System was designed to be based on SPX , you can use this indicator to trade $ES_F futures , SPY options, SPX options, and other indexes.
Some users are also using the 10/50SMA to trade other tickers such as TSLA based on the same set of rules.
The official documentation for The System is based on SPX so be careful deviating from that ruleset and be sure to backtest before jumping in to trades with this.
Note - this indicator is experimental and your mileage may vary.
Please learn the system by following @MasterBJones on Twitter
- Added setting to enable/disable entry alerts
- Added setting to show OverBought/OverSold bands. Options are None, Bollinger Bands (2sd line), Bollinger Band Bands (shading for the BB Band between 1sd and 2sd lines), or the 100pt Extended line for SPX.
- Added tooltips to labels
- Added Bollinger Bands for OverBought/OverSold levels, similar to how the 100pt extended lines work for SPX in TheSystem. Learn more about BB here: getthatcashmoney.com/blog/how-to-trade-with-bollinger-bands/
Skrip jemputan sahaja
Hanya pengguna disahkan oleh penulis boleh mengakses skrip ini. Anda perlu memohon dan mendapatkan kebenaran untuk menggunakannya. Keizinan selalunya diberikan selepas pembayaran. Untuk lebih butiran, ikuti arahan penulis di bawah atau hubungi getthatcashmoney secara terus.
Ambil maklum bahawa skrip peribadi dan jemputan sahaja ini masih belum disemak oleh moderator skrip dan pematuhannya dengan Peraturan Dalaman adalah belum ditentukan. TradingView TIDAK menyarankan pembayaran atau penggunaan skrip kecuali anda mempercayai sepenuhnya penulis dan memahami bagaimana ia berfungsi. Anda juga boleh menjumpai alternatif sumber terbuka dan percuma yang lain di dalam skrip komuniti kami.
Arahan penulis
Penafian
Skrip jemputan sahaja
Hanya pengguna disahkan oleh penulis boleh mengakses skrip ini. Anda perlu memohon dan mendapatkan kebenaran untuk menggunakannya. Keizinan selalunya diberikan selepas pembayaran. Untuk lebih butiran, ikuti arahan penulis di bawah atau hubungi getthatcashmoney secara terus.
Ambil maklum bahawa skrip peribadi dan jemputan sahaja ini masih belum disemak oleh moderator skrip dan pematuhannya dengan Peraturan Dalaman adalah belum ditentukan. TradingView TIDAK menyarankan pembayaran atau penggunaan skrip kecuali anda mempercayai sepenuhnya penulis dan memahami bagaimana ia berfungsi. Anda juga boleh menjumpai alternatif sumber terbuka dan percuma yang lain di dalam skrip komuniti kami.