OPEN-SOURCE SCRIPT
Telah dikemas kini [blackcat] L3 KAMA Trend Trading System
Level: 3
Background
Kaufman’s Adaptive Moving Average ( KAMA ) was developed by American quantitative financial theorist Perry J. Kaufman in 1998.
Function
This is an improved KAMA trading system with my customized algorithm.You can use KAMA like any other trend-following indicator, such as a moving average. You can look for price crosses, directional changes and filtered signals. First, a cross above or below KAMA indicates directional changes in prices. As with any moving average, a simple crossover system will generate lots of signals and lots of whipsaws. Second, You can use the direction of KAMA to define the overall trend for a security. This may require a parameter adjustment to smooth the indicator further. You can change the fastline and slowline parameters to smooth KAMA and look for directional changes. The trend is down as long as KAMA is falling and forging lower lows. The trend is up as long as KAMA is rising and forging higher highs. Finally, You can combine signals and techniques. You can use a longer-term KAMA to define the bigger trend and a shorter-term KAMA for trading signals.
I have included in the indicator an input named "EnableSmooth" that allows you to determine if the KAMA line should be smoothed or not. A "True" as the input value smoothes the calculation. An "False" simply plots the raw KAMA line. When market volatility is low, Kaufman’s Adaptive Moving Average remains near the current market price, but when volatility increases, it will lag behind. What the KAMA indicator aims to do is filter out “market noise” – insignificant, temporary surges in price action. One of the primary weaknesses of traditional moving averages is that when used for trading signals, they tend to generate many false signals. The KAMA indicator seeks to lessen this tendency – generate fewer false signals – by not responding to short-term, insignificant price movements. Traders generally use the moving average indicator to identify market trends and reversals.
Remarks
Feedbacks are appreciated.
Nota Keluaran
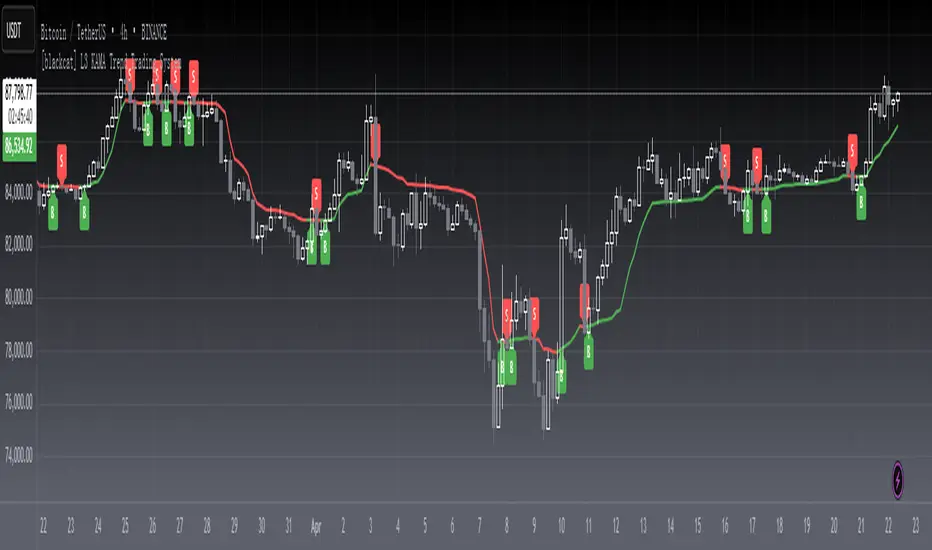
OVERVIEWThe L3 KAMA Trend Trading System is a powerful technical analysis tool that leverages the Kaufman Adaptive Moving Average (KAMA) to identify and capitalize on market trends. This comprehensive system analyzes multiple timeframes and provides clear buy/sell signals for traders of all experience levels.
CORE FEATURES
• Multi-Timeframe Analysis:
Primary 9-period KAMA line
Supporting 21, 34, and 55-period KAMAs
Dynamic trend recognition across timeframes 📊
• Intelligent Signal Processing:
Sophisticated filtering algorithms
False signal reduction mechanism
Clear visual representation of trading opportunities ✨
• Customization Options:
Adjustable KAMA period lengths
Toggleable smoothing feature
Various price source inputs (close, open, high, low)
HOW TO USE THE INDICATOR
Setup Phase:
Select appropriate price source
Set preferred KAMA period
Enable/disable smoothing feature
Interpretation Guide:
Observe green/red color coding of KAMA lines
Watch for crossover signals between price and KAMA
Note any divergences across timeframes
Trade Execution:
Enter trades at confirmed signal points
Exit positions based on trend changes
Maintain proper risk management protocols
ADVANCED TRADING STRATEGIES
• Trend Following Approach:
Focus on sustained moves along KAMA lines
Take advantage of momentum continuation
Scale positions as trend strengthens
• Counter-Trend Strategy:
Identify overextended moves beyond KAMA
Wait for pullbacks toward KAMA levels
Execute reversals with proper risk control
• Breakout Method:
Monitor price action relative to KAMA
Confirm breakouts with volume validation
Time entries near key support/resistance zones
PERFORMANCE METRICS
📊 Historical Performance Indicators:
Win rate statistics
Average trade duration
Profit factor calculations
Maximum drawdown measurements
LIMITATIONS AND CAVEATS
⚠️ Important Considerations:
Results may vary across different market conditions
Backtesting is essential before live implementation
No indicator guarantees consistent profits
External factors can influence market behavior
BEST PRACTICES
🚀 Recommended Usage Guidelines:
Always use proper position sizing
Maintain strict stop-loss discipline
Combine with fundamental analysis when possible
Regularly review and adjust parameters
TECHNICAL DETAILS
🛠️ Implementation Specifications:
Requires TradingView platform version 5
Compatible with various chart types
Supports real-time data streaming
Allows custom label placement and styling
CREDITS AND ACKNOWLEDGEMENTS
Special thanks to the TradingView development team and the global trading community for their contributions to improving this and similar technical analysis tools 🙏.
DISCLAIMER
This indicator is provided "as-is" without warranty of any kind. Users are responsible for their own trading decisions and should conduct thorough testing before applying these strategies to real money accounts.
Skrip sumber terbuka
Dalam semangat TradingView sebenar, pencipta skrip ini telah menjadikannya sumber terbuka, jadi pedagang boleh menilai dan mengesahkan kefungsiannya. Terima kasih kepada penulis! Walaupuan anda boleh menggunakan secara percuma, ingat bahawa penerbitan semula kod ini tertakluk kepada Peraturan Dalaman.
Avoid losing contact!Don't miss out! The first and most important thing to do is to join my Discord chat now! Click here to start your adventure: discord.com/invite/ZTGpQJq 防止失联,请立即行动,加入本猫聊天群: discord.com/invite/ZTGpQJq
Penafian
Maklumat dan penerbitan adalah tidak bertujuan, dan tidak membentuk, nasihat atau cadangan kewangan, pelaburan, dagangan atau jenis lain yang diberikan atau disahkan oleh TradingView. Baca lebih dalam Terma Penggunaan.