PROTECTED SOURCE SCRIPT
Range Breakout with Persistent Zone Bar Colors
// DESCRIPTION:
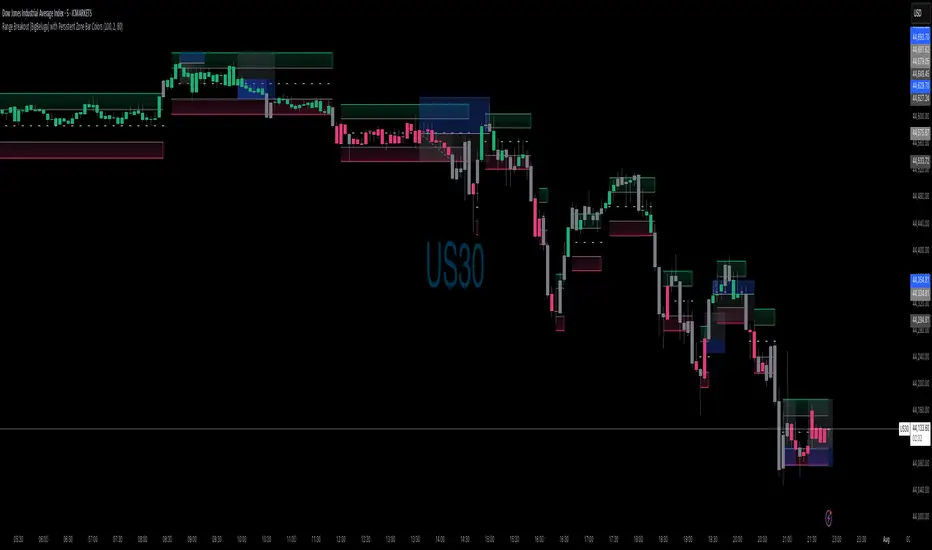
// The "Range Breakout [BigBeluga] with Persistent Zone Bar Colors" indicator identifies and visualizes
// periods of consolidation (boxes or channels) based on an ATR‑driven range and highlights
// directional breakouts, zone entries, and persistent zone trends.
//
// KEY FEATURES:
// 1. ATR‑Based Channel Construction:
// • Computes a rolling channel around the midpoint (HL2) using a historical ATR length,
// scaled by the "Channel Width" multiplier. This channel represents the box or range.
// • Automatically resets when price closes beyond the upper or lower boundary, or after
// a user‑defined maximum number of bars (Length) inside the range.
//
// 2. Persistent Zone Bar Coloring:
// • Colors bars within the current box uniformly—green for bullish zones after an
// upward breakout, red for bearish zones after a downward breakout—based on the last
// breakout direction (trend). Bars outside the box use a neutral color.
// • Provides an at‑a‑glance view of whether price remains in a bullish or bearish box.
//
// 3. Zone Entry & Breakout Signals:
// • "New Bull Box" / "New Bear Box" labels mark each new zone formation at the reset bar.
// • "Enter Bull Zone" and "Enter Bear Zone" tiny labels flag when price first crosses into
// the lower or upper half of the box, spotlighting momentum within the range.
// • Classic breakout symbols (▲ for buys, ▼ for sells) appear when price decisively crosses
// the box mid‑lines, with optional filtering by trend.
// • Optional X markers identify potential fakeout attempts beyond the box boundaries.
//
// 4. Customizable Inputs:
// • LENGTH: Maximum bars before auto‑reset if no breakout occurs.
// • CHANNEL WIDTH: ATR multiplier controlling box height.
// • Color settings for channel lines, fills, labels, and both inside/outside bar coloring.
// • Options to show fakeouts (X signals) and filter ▲/▼ by breakout trend.
//
// USE CASES:
// • Consolidation & Breakout Strategy: Clearly visualize ranges where price consolidates
// and prepare for directional entries on breakout or zone entry.
// • Trend Detection: Persistent bar colors provide quick confirmation of current zone bias.
// • Momentum Assessment: Mid‑zone entry labels highlight shifts in momentum within boxes.
// • Risk Management: Time‑based resets ensure the channel does not become stale if no
// breakout occurs.
//
// HOW TO READ:
// 1. Watch for the channel box formation (colored fills between upper and lower lines).
// 2. A label "New Bull Box" or "New Bear Box" indicates the start of a fresh zone.
// 3. Bars inside that zone remain uniformly colored until a new breakout resets the box.
// 4. "Enter Bull Zone" / "Enter Bear Zone" marks when price first enters each half.
// 5. ▲ / ▼ symbols on mid‑line crossovers signal potential entries.
// 6. Outside the box, bars turn neutral, highlighting no‑trade or transition periods.
// 7. Adjust inputs to fit the time frame and volatility of your market.
//
// By leveraging both visual zone coloring and precise labels, this indicator streamlines
// range analysis, breakout timing, and bias confirmation into a single, intuitive tool.
Skrip dilindungi
Skrip ini diterbitkan sebagai sumber tertutup. Akan tetapi, anda boleh menggunakannya secara bebas dan tanpa apa-apa had – ketahui lebih di sini.
Penafian
Maklumat dan penerbitan adalah tidak bertujuan, dan tidak membentuk, nasihat atau cadangan kewangan, pelaburan, dagangan atau jenis lain yang diberikan atau disahkan oleh TradingView. Baca lebih dalam Terma Penggunaan.