PROTECTED SOURCE SCRIPT
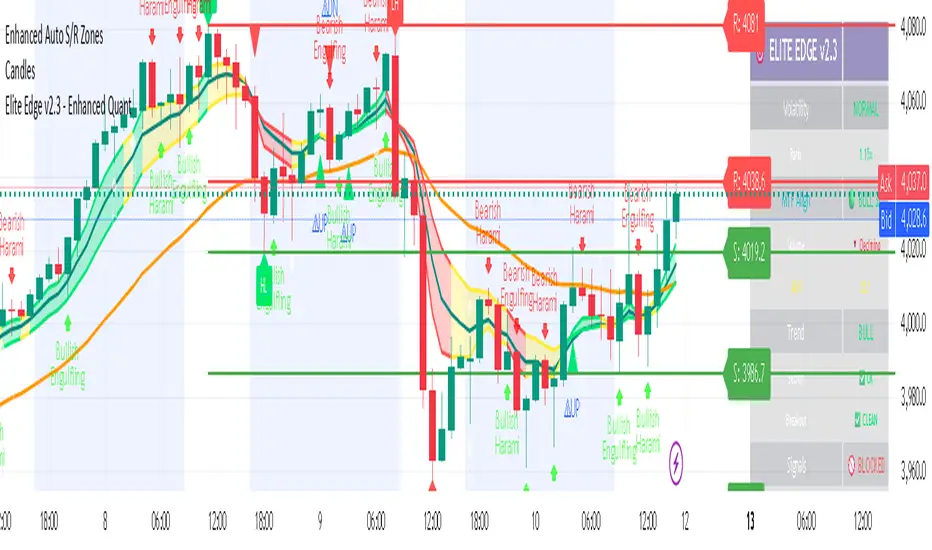
Elite Edge v2.3 - Enhanced Quant
This is an updated version of my previous indicator- Probability Score & UP/DOWN signals. I want to emphasize that "when not to trade".
Purpose: Make good trades obvious—and make bad trades easy to skip.
On-Chart Elements:
EMA 8 & EMA 34
Madrid Trend Ribbon (color = trend state)
Signal Arrows (BUY / SELL)
Signal Labels (shows setup quality)
Structure Labels (HH/HL/LH/LL — optional)
The Golden Rule: When Not to Trade
Skip the trade if any of the following are true:
Volatility Warning shows “🛑 EXTREME VOLATILITY”
Score < 70
MTF < 3/3
Signal quality is below GOOD
Dashboard is not ✅ ACTIVE or shows mixed/“not all green”
Chart is messy (overlapping signals, choppy price, no clean structure)
Quick Trading Flow (3 Checks)
See a Signal Arrow? (BUY/SELL on a clean chart)
Read the Signal Label:
Quality = ELITE / EXCELLENT / GOOD
Score ≥ 70
MTF = 3/3
Open the Dashboard:
Signals: ✅ ACTIVE
Statuses: all green (no warnings)
All 3 pass → Enter.
Any one fails → Skip.
Critical System Messages
Purple Label — “🛑 EXTREME VOLATILITY”
Meaning: Market regime is unstable (ratio > 2.5×)
Do: Stop trading; step away 30+ minutes
Dashboard: Volatility = EXTREME, Signals = 🚫 BLOCKED
Green Label — “✅ CLEAR TO TRADE”
Meaning: Volatility normalized; conditions OK
Do: Resume scanning for setups
Dashboard: Volatility = NORMAL, Signals = ✅ ACTIVE
What “Clean Chart” Means (at a glance)
Price respects EMA 8/34 and ribbon trend
Clear swing structure (HH/HL in uptrends, LH/LL in downtrends)
Few conflicting arrows; no chop cluster
No extreme spikes or gaps around signal
Signal Quality Cheatsheet
ELITE: Strong trend + structure + confluence → priority trade
EXCELLENT: Solid alignment, slight imperfection → tradable
GOOD: Meets minimum standards → optional; be strict with risk
Below GOOD: Do not trade
Risk & Discipline Nudge
Default R/R ≥ 1:2
Size down in rising volatility or mixed confluence
No FOMO: You will see another signal.
Polished LLM Prompt (for Claude or any LLM)
You are an experienced quantitative trader and technical analyst. I’m sharing a single chart (regular session only).
Analyze price action, trend structure, volume, key levels, candlestick patterns, moving averages, momentum, and support/resistance.
Deliver a clear plan:
Direction Bias: Bullish, Bearish, or Neutral — with reasoning.
Entry Zone(s): Price ranges with structure/indicator confluence.
Exit Plan: Target(s) and stop level with justification.
Short-Term vs. Medium-Term Outlook: e.g., continuation, reversal, consolidation.
Risk Management: Suggested position sizing or minimum R/R ≥ 1:2, with probability and confidence.
Assume standard market hours (no after-hours). Avoid mere description; give actionable guidance with probabilities and confidence. Now evaluate the attached chart and advise.
Skrip dilindungi
Skrip ini diterbitkan sebagai sumber tertutup. Akan tetapi, anda boleh menggunakannya dengan percuma dan tanpa had – ketahui lebih lanjut di sini.
Penafian
Maklumat dan penerbitan adalah tidak dimaksudkan untuk menjadi, dan tidak membentuk, nasihat untuk kewangan, pelaburan, perdagangan dan jenis-jenis lain atau cadangan yang dibekalkan atau disahkan oleh TradingView. Baca dengan lebih lanjut di Terma Penggunaan.