OPEN-SOURCE SCRIPT
All-In-One: Moving Averages, Ichimoku cloud, Volume candle
Tired of install multiple basis indicators? This indicator allows you to install only one but you will have all basis indicators for your chart. Currently, it includes the following
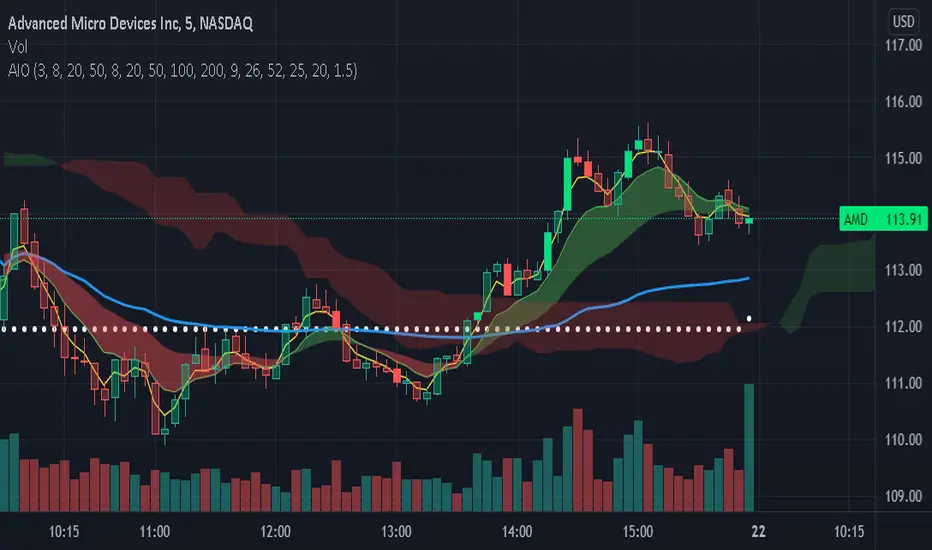
This script is particularly helpful for short timeframe chart, like M5. While it can show EMA or SAM for current time frame (up to 4 lines, user can change the length period for each lines to suit user's needs), it does plot up to 5 daily SMA lines. Default settings are for 8, 20, 50, 100, 200 SMA. The lines can be show or not be shown by the choice of user. Volume Weighted Average Price (VWAP), a technical analysis tool used to measure the average price weighted by volume, is also available in this indication.
In addition, this indicator can show two clouds: The first one is the EMA (or SMA) cloud, which plot the region between two EMA (or SMA) lines (the second and the third) of current timeframe, the second one is the Ichimoku cloud (the details of which can be found here tradingview.com/support/solutions/43000589152-ichimoku-cloud/).
The last feature is the Volume candle indicator. This indicator will highlight the candle with volume higher than volume threshold times of current simple moving average of the volume. The default setting is 1.5 * 20 period moving average of volume.
Even though this indicator has many different indicators in it, user can easily to turn off any of them.
If you have any unused tradingview coin, Comment with Cheer to support my work.
- Daily moving averages: Include 5 SMA lines
- Current timeframe moving averages: Include 4 EMA or SMA lines
- VWAP
- EMA (or SMA ) cloud, filled between EMA ( SMA ) #2 and #3 of current timeframe
- Ichimoku cloud
- Volume candle: Candle with high volume will be highlighted
This script is particularly helpful for short timeframe chart, like M5. While it can show EMA or SAM for current time frame (up to 4 lines, user can change the length period for each lines to suit user's needs), it does plot up to 5 daily SMA lines. Default settings are for 8, 20, 50, 100, 200 SMA. The lines can be show or not be shown by the choice of user. Volume Weighted Average Price (VWAP), a technical analysis tool used to measure the average price weighted by volume, is also available in this indication.
In addition, this indicator can show two clouds: The first one is the EMA (or SMA) cloud, which plot the region between two EMA (or SMA) lines (the second and the third) of current timeframe, the second one is the Ichimoku cloud (the details of which can be found here tradingview.com/support/solutions/43000589152-ichimoku-cloud/).
The last feature is the Volume candle indicator. This indicator will highlight the candle with volume higher than volume threshold times of current simple moving average of the volume. The default setting is 1.5 * 20 period moving average of volume.
Even though this indicator has many different indicators in it, user can easily to turn off any of them.
If you have any unused tradingview coin, Comment with Cheer to support my work.
Skrip sumber terbuka
Dalam semangat sebenar TradingView, pencipta skrip ini telah menjadikannya sumber terbuka supaya pedagang dapat menilai dan mengesahkan kefungsiannya. Terima kasih kepada penulis! Walaupun anda boleh menggunakannya secara percuma, ingat bahawa menerbitkan semula kod ini adalah tertakluk kepada Peraturan Dalaman kami.
Penafian
Maklumat dan penerbitan adalah tidak dimaksudkan untuk menjadi, dan tidak membentuk, nasihat untuk kewangan, pelaburan, perdagangan dan jenis-jenis lain atau cadangan yang dibekalkan atau disahkan oleh TradingView. Baca dengan lebih lanjut di Terma Penggunaan.