OPEN-SOURCE SCRIPT
Telah dikemas kini Hidden Markov Model
Overview
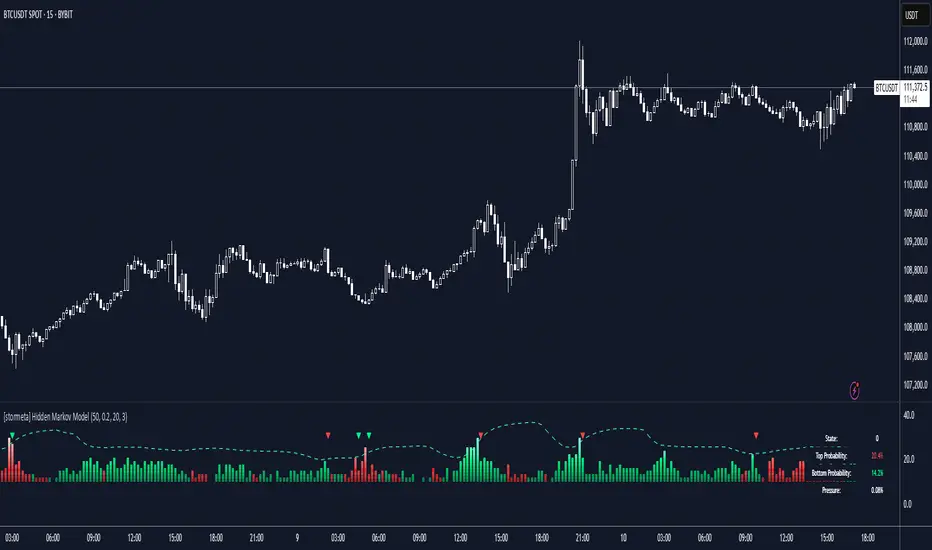
This model uses a Hidden Markov Model to identify and predict market regimes in real-time. It is designed to probabilistically identify market regime changes and predict potential reversal point using a forward algorithm to calculate the probability of a state.
Unlike traditional technical indicators that rely on price patterns or moving averages, this HMM analyses the underlying statistical structure of market movements to detect when the market transitions between different behavioural states such as trending, ranging, or volatile periods
How it works
The HMM assumes that market behavior follows hidden states that aren't directly observable, but can be inferred from observable market data (emissions). The model uses a (somewhat simplified) Bayesian inference to estimate these probabilities.
State 0: (Normal Trading): Market continuation patterns, balanced buying/selling
State 1: (Top Formation): Exhaustion patterns at price highs
State 2: (Bottom Formation): Capitulation patterns at price lows
How to use
1) Identify the trend (you can also use it counter-trend)
2) For longing, look for a green arrow. The probability values should be red. For shorting, look for a red arrow. The probability values should be green
3) For added confluence, look for high probability values of above 25%.
Advantages and what makes it unique
Unlike moving averages or oscillators that react to price changes, the HMM proactively identifies the underlying market structure. This forward-looking approach can signal regime changes before they become apparent in price action, providing traders with an informational edge.
Nota Keluaran
Mathematical Functionsmath.log() - Used to calculate logarithmic returns for price analysis, which normalizes price changes and makes them more statistically workable.
math.abs() - Used to get absolute values for return magnitude, price velocity calculations, and deviation measurements.
math.min() - Used in adaptive learning to cap maximum values when updating transition probabilities.
math.max() - Used in adaptive learning to set minimum bounds when updating transition probabilities.
math.floor() - Used to convert probability percentages into discrete row counts for the visual probability display.
Technical Analysis Functions
ta.highest() - Used in the normalize_price function to find the highest price over a lookback period for price normalization.
ta.lowest() - Used in the normalize_price function to find the lowest price over a lookback period for price normalization.
ta.sma() - Used to create moving averages of recent volatility for comparison in emission probability calculations and learning algorithms.
ta.stdev() - Used to calculate standard deviation of signal strength for outlier threshold detection.
ta.ema() - Used to smooth the outlier detection line, providing a more responsive moving average than SMA.
ta.crossunder() - Used to detect when probability values cross below the outlier detection line for generating signal alerts.
Utility Functions
str.tostring() - Used to format numerical values for display in the information table.
table.new() - Used to create the information display table showing current state and probabilities.
table.cell() - Used to populate individual cells in the information table with formatted data.
table.clear() - Used to clear table contents before updating with new values.
Plotting Functions
plotshape() - Used extensively to create the visual probability columns (colored squares) and signal arrows.
plot() - Used to display the outlier detection line on the chart.
hline() - Used to create transparent boundary lines at the top and bottom of the indicator.
Alert Functions
alert() - Used to generate trading alerts when confirmed top or bottom signals are detected.
Skrip sumber terbuka
Dalam semangat TradingView sebenar, pencipta skrip ini telah menjadikannya sumber terbuka, jadi pedagang boleh menilai dan mengesahkan kefungsiannya. Terima kasih kepada penulis! Walaupuan anda boleh menggunakan secara percuma, ingat bahawa penerbitan semula kod ini tertakluk kepada Peraturan Dalaman.
Penafian
Maklumat dan penerbitan adalah tidak bertujuan, dan tidak membentuk, nasihat atau cadangan kewangan, pelaburan, dagangan atau jenis lain yang diberikan atau disahkan oleh TradingView. Baca lebih dalam Terma Penggunaan.