PROTECTED SOURCE SCRIPT
Telah dikemas kini TREND_Filter by Yogesh_Mandloi
📈 TREND Indicator by Yogesh Mandloi
The TREND Indicator is a multi-factor momentum and trend confirmation tool built for TradingView. It combines RSI, EMA/SMA crossovers, and MACD to deliver reliable buy/sell signals on the 4-hour timeframe, complete with visual cues, strength analysis, and a customizable signal table.
✅ Core Features
🔍 Signal Logic:
Buy Condition:
RSI > 50
EMA21 > SMA55 High
MACD Line > 0
Sell Condition:
RSI < 50
EMA21 < SMA55 Low
MACD Line < 0
🔁 First-Bar Signal Alerts:
Arrows are shown only on the first occurrence of the trend signal for clearer entries.
📊 Trend Strength Scoring:
Composite strength score using:
RSI distance from 50
EMA distance from SMA
MACD Line magnitude
Displays:
Strong Bull, Moderate Bull, Weak Bull
Strong Bear, Moderate Bear, Weak Bear
Neutral when no signal present
🧠 Signal Table (Optional):
A compact, color-coded table that displays:
RSI, MA, MACD conditions with arrow icons
Trend strength label and color
Live indicator values (optional toggle)
Buy/Sell signal summary
🎯 Alerts Ready:
Instant alerts for buy/sell conditions with customizable messages.
🌈 Visual Feedback:
Green/red background highlights during active signals
Clear "BUY"/"SELL" arrow labels on the chart
🧩 Customization Options
Show/hide individual signal conditions (RSI, MA, MACD)
Show/hide trend strength and summary
Toggle real-time indicator values in the table
Position the table anywhere on the chart
📌 Use Case
This indicator is ideal for trend traders, swing traders, or multi-timeframe analysts who want a consolidated signal confirmation system that’s both visual and statistically informed.
Nota Keluaran
The TREND Indicator is a multi-factor momentum and trend confirmation tool built for TradingView. It combines RSI, EMA/SMA crossovers, and MACD to deliver reliable buy/sell signals on the 4-hour timeframe, complete with visual cues, strength analysis, and a customizable signal table.✅ Core Features
🔍 Signal Logic:
Buy Condition:
RSI > 50
EMA21 > SMA55 High
MACD Line > 0
Sell Condition:
RSI < 50
EMA21 < SMA55 Low
MACD Line < 0
🔁 First-Bar Signal Alerts:
Arrows are shown only on the first occurrence of the trend signal for clearer entries.
📊 Trend Strength Scoring:
Composite strength score using:
RSI distance from 50
EMA distance from SMA
MACD Line magnitude
Displays:
Strong Bull, Moderate Bull, Weak Bull
Strong Bear, Moderate Bear, Weak Bear
Neutral when no signal present
🧠 Signal Table (Optional):
A compact, color-coded table that displays:
RSI, MA, MACD conditions with arrow icons
Trend strength label and color
Live indicator values (optional toggle)
Buy/Sell signal summary
🎯 Alerts Ready:
Instant alerts for buy/sell conditions with customizable messages.
🌈 Visual Feedback:
Green/red background highlights during active signals
Clear "BUY"/"SELL" arrow labels on the chart
🧩 Customization Options
Show/hide individual signal conditions (RSI, MA, MACD)
Show/hide trend strength and summary
Toggle real-time indicator values in the table
Position the table anywhere on the chart
📌 Use Case
This indicator is ideal for trend traders, swing traders, or multi-timeframe analysts who want a consolidated signal confirmation system that’s both visual and statistically informed.
Nota Keluaran
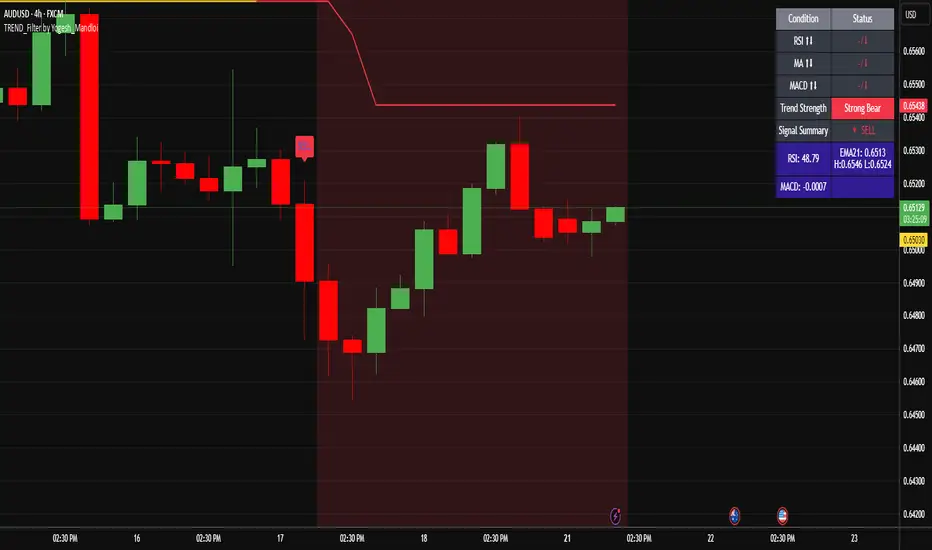
🔍 TREND_Filter by Yogesh Mandloi — DescriptionThis Pine Script indicator is an advanced trend confirmation and signal generation tool, designed for use on TradingView. It combines a multi-timeframe SuperTrend indicator with RSI, EMA/SMA crossovers, and MACD on a higher timeframe (4H by default) to provide buy/sell signals, trend strength, and an easy-to-read signal table.
🧠 Core Features
✅ 1. Multi-Timeframe SuperTrend
Uses the Electrified/SupportResitanceAndTrend module.
Fully customizable: supports SMA, EMA, WMA, VWMA, VAWMA.
Pulls SuperTrend values from a customizable timeframe (default: 4H).
Plots up/down trends, warns on trend uncertainty or reversal.
Buy/Sell shape labels are triggered when trend direction changes.
✅ 2. Confirmation Indicators (4H Timeframe)
RSI (Relative Strength Index > 40 for buy, < 60 for sell).
EMA21 vs SMA55 (High/Low) crossover.
MACD line vs 0 (positive for buy, negative for sell).
Logic combines SuperTrend + EMA + RSI/MACD for enhanced accuracy.
✅ 3. Signal Arrows & Conditions
Green BUY or Red SELL labels below/above candles.
Color-coded background highlights trend zones:
🟩 Light green = Buy zone.
🟥 Light red = Sell zone.
✅ 4. Trend Strength Classification
Labels trends into:
Strong Bull: All buy conditions confirmed.
Weak Bull: Partial buy signals.
Strong Bear / Weak Bear: Mirror logic for sell.
Neutral when no alignment.
✅ 5. Dynamic Signal Table
Toggle visibility of the signal table.
Position: top/bottom, left/right.
Conditions shown:
RSI
MA crossover
MACD direction
Trend Strength
Summary: ✅ BUY / 🔻 SELL / ⏸️ WAIT
RSI value, EMA/SMA levels, MACD value (if enabled).
✅ 6. Alerts
Custom alert conditions for:
SuperTrend warnings & reversals.
Trend changes (Buy/Sell).
Activation of Bullish/Bearish zones.
⚙️ Customizable Inputs
🔄 SuperTrend Settings: ATR period, multiplier, smoothing mode, etc.
📈 Confirmation Toggles: RSI, MA, MACD, show/hide parts of the table.
🧾 Signal Table Preferences: Show/hide values, summary, positioning.
📌 Best For
Traders looking for confirmed, filtered trend signals.
Use on any symbol; 4H timeframe used as confirmation layer.
Works great in trend-following or swing trading strategies
Skrip dilindungi
Skrip ini diterbitkan sebagai sumber tertutup. Akan tetapi, anda boleh menggunakannya dengan percuma dan tanpa had – ketahui lebih lanjut di sini.
Penafian
Maklumat dan penerbitan adalah tidak dimaksudkan untuk menjadi, dan tidak membentuk, nasihat untuk kewangan, pelaburan, perdagangan dan jenis-jenis lain atau cadangan yang dibekalkan atau disahkan oleh TradingView. Baca dengan lebih lanjut di Terma Penggunaan.