OPEN-SOURCE SCRIPT
SMA Trend Spectrum [InvestorUnknown]
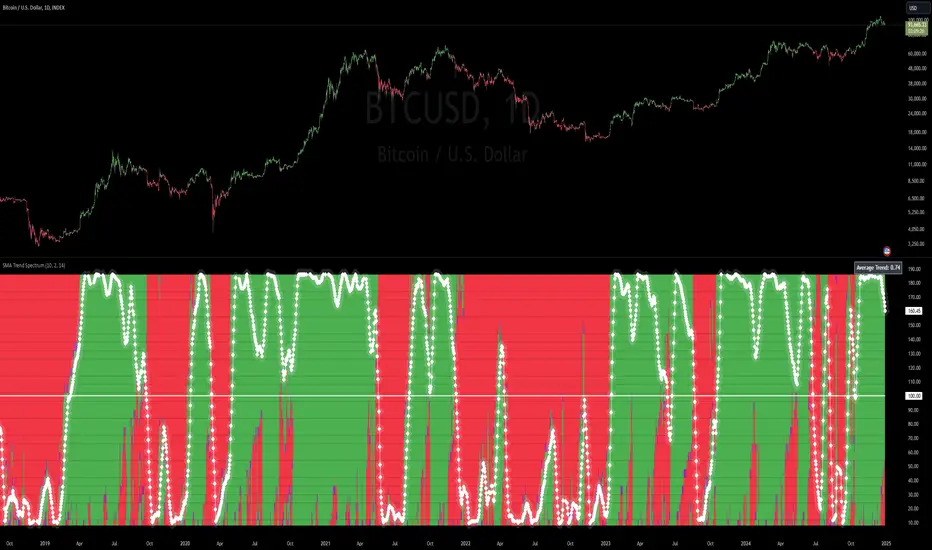
The SMA Trend Spectrum indicator is designed to visually represent market trends and momentum by using a series of Simple Moving Averages (SMAs) to create a color-coded spectrum or heatmap. This tool helps traders identify the strength and direction of market trends across various time frames within one chart.
Functionality:

Pine Script®


Additional Features:
Usage:
Notes:
Disclaimer: Past performance does not guarantee future results. Always use this indicator as part of a broader trading strategy.
Functionality:
- SMA Calculation: The indicator calculates multiple SMAs starting from a user-defined base period (Starting Period) and increasing by a specified increment (Period Increment). This creates a sequence of moving averages that span from short-term to long-term perspectives.
- Trend Analysis: Each segment of the spectrum compares three SMAs to determine the market's trend strength: Bullish (color-coded green) when the current price is above all three SMAs. Neutral (color-coded purple) when the price is above some but not all SMAs. Bearish (color-coded red) when the price is below all three SMAs.
f_col(x1, x2, x3) =>
min = ta.sma(src, x1)
mid = ta.sma(src, x2)
max = ta.sma(src, x3)
c = src > min and src > mid and src > max ? bull : src > min or src > mid or src > max ? ncol : bear
- Heatmap Visualization: The indicator plots these trends as a vertical spectrum where each row represents a different set of SMAs, forming a heatmap-like display. The color of each segment in the heatmap directly correlates with market conditions, providing an intuitive view of market sentiment.
- Signal Smoothing: Users can choose to smooth the trend signal using either a Simple Moving Average (SMA), Exponential Moving Average (EMA), or leave it as raw data (Signal Smoothing). The length of smoothing can be adjusted (Smoothing Length). The signal is displayed in a scaled way to automatically adjust for the best visual experience, ensuring that the trend is clear and easily interpretable across different chart scales and time frames
Additional Features:
- Plot Signal: Optionally plots a line representing the average trend across all calculated SMAs. This line helps in identifying the overall market direction based on the spectrum data.
- Bar Coloring: Bars on the chart can be colored according to the average trend strength, providing a quick visual cue of market conditions.
Usage:
- Trend Identification: Use the heatmap to quickly assess if the market is trending strongly in one direction or if it's in a consolidation phase.
- Entry/Exit Points: Look for shifts in color patterns to anticipate potential trend changes or confirmations for entry or exit points.
- Momentum Analysis: The gradient from bearish to bullish across the spectrum can be used to gauge momentum and potentially forecast future price movements.
Notes:
- The effectiveness of this indicator can vary based on market conditions, asset volatility, and the chosen SMA periods and increments.
- It's advisable to combine this tool with other technical indicators or fundamental analysis for more robust trading decisions.
Disclaimer: Past performance does not guarantee future results. Always use this indicator as part of a broader trading strategy.
Skrip sumber terbuka
Dalam semangat sebenar TradingView, pencipta skrip ini telah menjadikannya sumber terbuka supaya pedagang dapat menilai dan mengesahkan kefungsiannya. Terima kasih kepada penulis! Walaupun anda boleh menggunakannya secara percuma, ingat bahawa menerbitkan semula kod ini adalah tertakluk kepada Peraturan Dalaman kami.
Penafian
Maklumat dan penerbitan adalah tidak dimaksudkan untuk menjadi, dan tidak membentuk, nasihat untuk kewangan, pelaburan, perdagangan dan jenis-jenis lain atau cadangan yang dibekalkan atau disahkan oleh TradingView. Baca dengan lebih lanjut di Terma Penggunaan.