PROTECTED SOURCE SCRIPT
Telah dikemas kini Modified Color Relative Strength Index
This indicator is old normal RSI, but I have Modified its Color, to make trade able to investigate the trend easier
This indicator uses the concept of:
- RSI Relative Strength Index
- and Many Different MA (For example EMA SMA RMA LSMA WMA etc.)
There are 2 line displays in this indicator
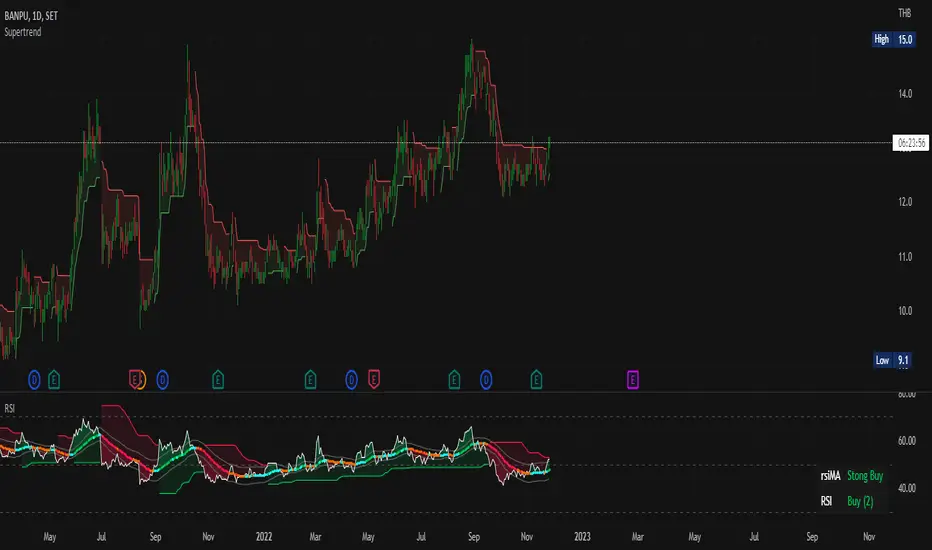
1) Normal RSI line, Default is set as White color
2) MA line which calculates from RSI, a trader can choose the model to calculate RSIMA in setting
How Modified Color Relative Strength Index work?
We use RSI as we normally use, but the RSIMA is a little different in this Indicator
I use the idea that if RSI is over RSIMA, the Trend seems to be Uptrend which will display as a Green color filled. Same as if RSI is lower than RSI MA that trend seems to be a Down Trend.
With this idea, we can identify the trend of the chart but we still don't know whether the trend is strong or not, to satisfy this problem the change rate of RSIMA came into its role.
Now let me reviewing you some of my 5-grade math ideas:
Remember how to calculate the Average value? that's right we sum all of the values and divide it all by the amount of the number
for example, we want to calculate the average value of 1 2 3 4 5 so it should be (1+2+3+4+5)/5 which is the amount of number and then we get the average value of 1 2 3 4 5 = 3
now apply that concept to the change in RSIMA value
There will be 3 stages of the color displayed in RSIMA
1) Green will be displayed if the rate of change or RSIMA is over X time average rate of change of this RSIMA while trader and change X in the setting (Positive value)
2) Red will be displayed if the rate of change or RSIMA is over X time average rate of change of this RSIMA while trader and change X in the setting (Negative value)
3) Light Blue and Orange (Gray) will be displayed if the rate of change or RSIMA is not over X time average rate of change of this RSIMA while trader and change X in the setting if the recently is red the RSIMA line will be orange while it is green, RSIMA will be color in Light Blue
Green and Red can be a help to confirm, how strong the trend is. While Light blue and Orange mean there is a small amount of change so traders should be prepared to Buy/Sell
Use of Modified Color Relative Strength Index
When the area between RSI and RSIMA is Green and RSIMA is colored in Green, That is a Strong Uptrend
Same a Strong Down Trend, area between RSI and RSIMA need to be RED and RSIMA colored in red too,
other than this is considered as a sideway Trend or weak Trend
Apply RSI with other Indicator
- You can use any indicator that can help you enter the trade easier with it
- I personally use it with MACD, BB Band, and UT Bot Alerts
This indicator uses the concept of:
- RSI Relative Strength Index
- and Many Different MA (For example EMA SMA RMA LSMA WMA etc.)
There are 2 line displays in this indicator
1) Normal RSI line, Default is set as White color
2) MA line which calculates from RSI, a trader can choose the model to calculate RSIMA in setting
How Modified Color Relative Strength Index work?
We use RSI as we normally use, but the RSIMA is a little different in this Indicator
I use the idea that if RSI is over RSIMA, the Trend seems to be Uptrend which will display as a Green color filled. Same as if RSI is lower than RSI MA that trend seems to be a Down Trend.
With this idea, we can identify the trend of the chart but we still don't know whether the trend is strong or not, to satisfy this problem the change rate of RSIMA came into its role.
Now let me reviewing you some of my 5-grade math ideas:
Remember how to calculate the Average value? that's right we sum all of the values and divide it all by the amount of the number
for example, we want to calculate the average value of 1 2 3 4 5 so it should be (1+2+3+4+5)/5 which is the amount of number and then we get the average value of 1 2 3 4 5 = 3
now apply that concept to the change in RSIMA value
There will be 3 stages of the color displayed in RSIMA
1) Green will be displayed if the rate of change or RSIMA is over X time average rate of change of this RSIMA while trader and change X in the setting (Positive value)
2) Red will be displayed if the rate of change or RSIMA is over X time average rate of change of this RSIMA while trader and change X in the setting (Negative value)
3) Light Blue and Orange (Gray) will be displayed if the rate of change or RSIMA is not over X time average rate of change of this RSIMA while trader and change X in the setting if the recently is red the RSIMA line will be orange while it is green, RSIMA will be color in Light Blue
Green and Red can be a help to confirm, how strong the trend is. While Light blue and Orange mean there is a small amount of change so traders should be prepared to Buy/Sell
Use of Modified Color Relative Strength Index
When the area between RSI and RSIMA is Green and RSIMA is colored in Green, That is a Strong Uptrend
Same a Strong Down Trend, area between RSI and RSIMA need to be RED and RSIMA colored in red too,
other than this is considered as a sideway Trend or weak Trend
Apply RSI with other Indicator
- You can use any indicator that can help you enter the trade easier with it
- I personally use it with MACD, BB Band, and UT Bot Alerts
Nota Keluaran
Add 99.99% Confident Rate ZoneAdd State Table showing how RSI and RSI MA Rating are
Nota Keluaran
Change Color Nota Keluaran
add Supertrend Concept to RSI and RSIMASkrip dilindungi
Skrip ini diterbitkan sebagai sumber tertutup. Akan tetapi, anda boleh menggunakannya secara bebas dan tanpa apa-apa had – ketahui lebih di sini.
Penafian
Maklumat dan penerbitan adalah tidak bertujuan, dan tidak membentuk, nasihat atau cadangan kewangan, pelaburan, dagangan atau jenis lain yang diberikan atau disahkan oleh TradingView. Baca lebih dalam Terma Penggunaan.
Skrip dilindungi
Skrip ini diterbitkan sebagai sumber tertutup. Akan tetapi, anda boleh menggunakannya secara bebas dan tanpa apa-apa had – ketahui lebih di sini.
Penafian
Maklumat dan penerbitan adalah tidak bertujuan, dan tidak membentuk, nasihat atau cadangan kewangan, pelaburan, dagangan atau jenis lain yang diberikan atau disahkan oleh TradingView. Baca lebih dalam Terma Penggunaan.