OPEN-SOURCE SCRIPT
Telah dikemas kini Significance Condensed
// Indicator Name: "Significance Condensed"
// This is a "Multi-Indicator", which includes:
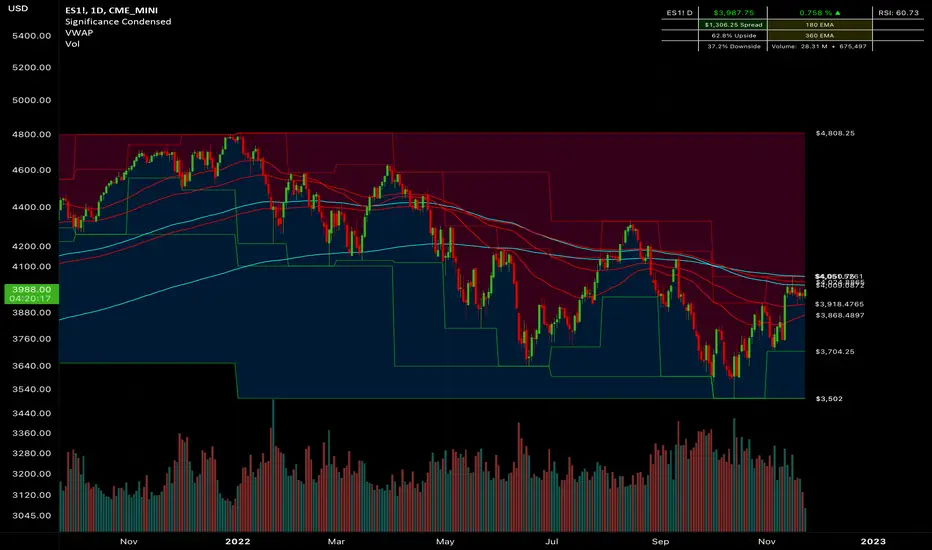
// Custom Candlesticks with Bearish/Bullish Engulfing Body Fills, otherwise hollow.
// 3 EMA's with user inputs + 2 Static EMA's
// Continuous plots of high/low values with up to 3 overlapping timeframes.
// Table: Contains the TICKER.ID, Current Price, Percent On Day (note that it does not work for extended hours charts well), Current Timeframe RSI Value(Adjustable), Spread(Difference from the Current Price to High value, 2 Static EMA displays, Upside/Downside(Percentile from Current Price to High/Low Range, respectively, and Volume(Daily Volume + Current Bar Volume)
//CANDLESTICK DISCLAIMER
// If you would like to use the custom candlestick plots, (hollow, else engulfing), that come along with this indicator,
// be sure to disable the Candlestick Body, Wick, and Border under Chart Appearance; and then enable "Candlesticks Active" in the indicator settings.
//Final Product. Finito. Done.
// This is a "Multi-Indicator", which includes:
// Custom Candlesticks with Bearish/Bullish Engulfing Body Fills, otherwise hollow.
// 3 EMA's with user inputs + 2 Static EMA's
// Continuous plots of high/low values with up to 3 overlapping timeframes.
// Table: Contains the TICKER.ID, Current Price, Percent On Day (note that it does not work for extended hours charts well), Current Timeframe RSI Value(Adjustable), Spread(Difference from the Current Price to High value, 2 Static EMA displays, Upside/Downside(Percentile from Current Price to High/Low Range, respectively, and Volume(Daily Volume + Current Bar Volume)
//CANDLESTICK DISCLAIMER
// If you would like to use the custom candlestick plots, (hollow, else engulfing), that come along with this indicator,
// be sure to disable the Candlestick Body, Wick, and Border under Chart Appearance; and then enable "Candlesticks Active" in the indicator settings.
//Final Product. Finito. Done.
Nota Keluaran
Added a tooltip to the Timeframe that is coordinated to the Spread Math on the table.Corrected a mis-titled User Ema
Corrected Timeframe Logic Flow for Ease of Understanding.
Changed some Default Colors.
Mr. Storm
Enjoy!
Skrip sumber terbuka
Dalam semangat TradingView sebenar, pencipta skrip ini telah menjadikannya sumber terbuka, jadi pedagang boleh menilai dan mengesahkan kefungsiannya. Terima kasih kepada penulis! Walaupuan anda boleh menggunakan secara percuma, ingat bahawa penerbitan semula kod ini tertakluk kepada Peraturan Dalaman.
Penafian
Maklumat dan penerbitan adalah tidak bertujuan, dan tidak membentuk, nasihat atau cadangan kewangan, pelaburan, dagangan atau jenis lain yang diberikan atau disahkan oleh TradingView. Baca lebih dalam Terma Penggunaan.