OPEN-SOURCE SCRIPT
EMA Pullback & Trend Indicator Myraxes
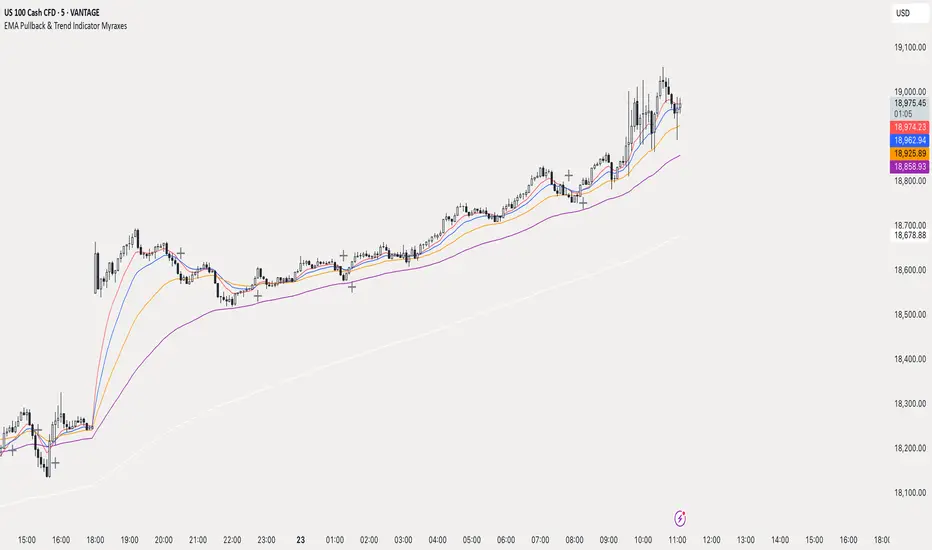
EMA Pullback & Trend Indicator by Max Retri
Plots five EMAs—9, 15, 30, 65 and 200—and draws clean, easy-to-interpret signals when the fast EMAs cross in the direction of the longer-term trend. No other indicators or overlays are required; simply add it to your chart and watch for the arrows and crosses.
⸻
What It Does & How It Works
1. EMAs & Colors
2. Trend Filter
3. Pullback Requirement
4. Signal Logic
⸻
How to Use
Because it’s a pure‐EMA indicator (no heavy calculations), it runs quickly even on lower-end machines.
Plots five EMAs—9, 15, 30, 65 and 200—and draws clean, easy-to-interpret signals when the fast EMAs cross in the direction of the longer-term trend. No other indicators or overlays are required; simply add it to your chart and watch for the arrows and crosses.
⸻
What It Does & How It Works
1. EMAs & Colors
- • Red (EMA 9) – Fast signal line
- • Blue (EMA 15) – Confirmation line
- • Orange (EMA 30) – Pullback zone 1
- • Purple (EMA 65) – Pullback zone 2 & mid-term trend
- • White (EMA 200) – Long-term trend
2. Trend Filter
- • Bullish regime when price is above both EMA 65 and EMA 200.
- • Bearish regime when price is below both EMA 65 and EMA 200.
3. Pullback Requirement
- • Only consider a signal if price has retraced into the EMA 30 or EMA 65 zone.
4. Signal Logic
- Long Entry ▲: EMA 9 (red) crosses above EMA 15 (blue) while in a bullish regime and after a pullback into EMA 30/65.
- Short Entry ▼: EMA 9 crosses below EMA 15 while in a bearish regime and after a retracement up to EMA 30/65.
- Exit ✖: Opposite EMA 9/15 crossover marks the close of the position.
⸻
How to Use
- 1. Add the indicator to any chart/timeframe.
- 2. Identify trend: make sure price is aligned above or below the 65 and 200 EMAs.
- 3. Watch for pullbacks into the orange or purple EMAs.
- 4. Enter on the black ▲ or ▼ arrow.
- 5. Exit when you see the gray ✖ cross.
Because it’s a pure‐EMA indicator (no heavy calculations), it runs quickly even on lower-end machines.
Skrip sumber terbuka
Dalam semangat TradingView sebenar, pencipta skrip ini telah menjadikannya sumber terbuka, jadi pedagang boleh menilai dan mengesahkan kefungsiannya. Terima kasih kepada penulis! Walaupuan anda boleh menggunakan secara percuma, ingat bahawa penerbitan semula kod ini tertakluk kepada Peraturan Dalaman.
Penafian
Maklumat dan penerbitan adalah tidak bertujuan, dan tidak membentuk, nasihat atau cadangan kewangan, pelaburan, dagangan atau jenis lain yang diberikan atau disahkan oleh TradingView. Baca lebih dalam Terma Penggunaan.