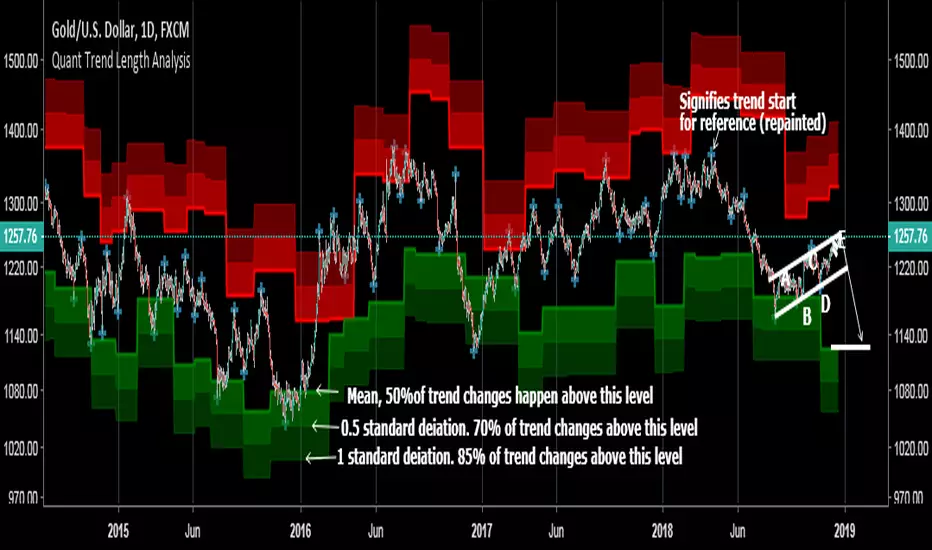
Statistical Trend Length Analysis (Quant indicator)

This indicator back-tests ALL of the data, calculates the length of all past trends, and does a statistical analysis of trend changes at different levels. The more recent data is more accurate as it learns as the indicator goes along.
These levels can be used in regression to the mean trading, as it gives you an idea of the statistical likeliness of a trend change or pullback occurring in each zone. An average trend length is a very good point to enter when trading a pullback within a trend, although without a complex analysis like this it would be impossible to determine where that is.
PM me for access, and more details on strategies that can be implemented using this indicator.
Skrip jemputan sahaja
Hanya pengguna disahkan oleh penulis boleh mengakses skrip ini. Anda perlu memohon dan mendapatkan kebenaran untuk menggunakannya. Keizinan selalunya diberikan selepas pembayaran. Untuk lebih butiran, ikuti arahan penulis di bawah atau hubungi JamesRkaye secara terus.
TradingView TIDAK menyarankan pembayaran atau penggunaan skrip kecuali anda mempercayai sepenuhnya penulis dan memahami bagaimana ia berfungsi. Anda juga boleh menjumpai alternatif sumber terbuka dan percuma yang lain di dalam skrip komuniti kami.
Arahan penulis
Penafian
Skrip jemputan sahaja
Hanya pengguna disahkan oleh penulis boleh mengakses skrip ini. Anda perlu memohon dan mendapatkan kebenaran untuk menggunakannya. Keizinan selalunya diberikan selepas pembayaran. Untuk lebih butiran, ikuti arahan penulis di bawah atau hubungi JamesRkaye secara terus.
TradingView TIDAK menyarankan pembayaran atau penggunaan skrip kecuali anda mempercayai sepenuhnya penulis dan memahami bagaimana ia berfungsi. Anda juga boleh menjumpai alternatif sumber terbuka dan percuma yang lain di dalam skrip komuniti kami.