OPEN-SOURCE SCRIPT
alert!!!!
alerts work over values of plots on the chart. could not find a way to add an alert when a strategy is triggered.
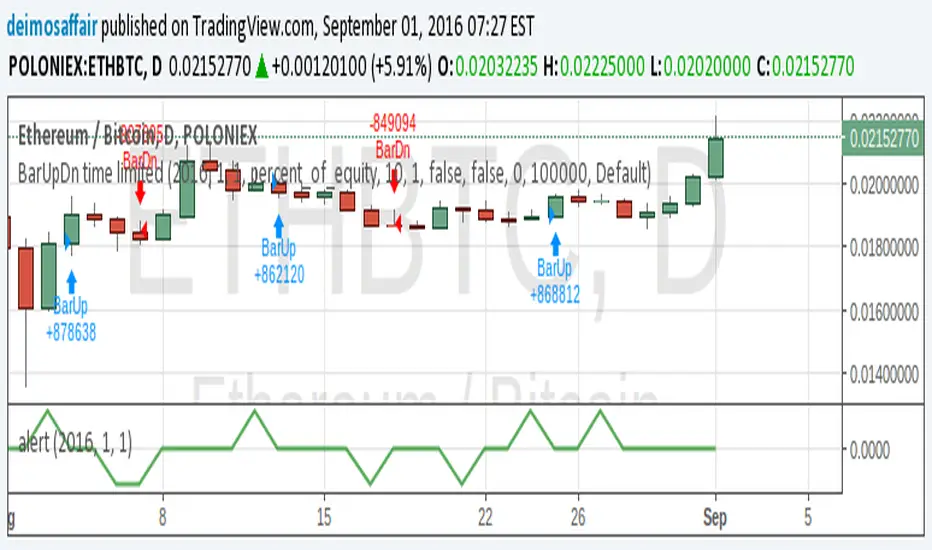
so, i created an alert chart that uses the same conditions as the strategy(i published the example strat in my previous script). an alert chart should be mostly zero, but when the strat fires up, the alert = 1, and when the strat fires down, alert = -1. this way it's easy to check the chart for alerts.
but, if i'm looking at the cahrt and see the strat's arrows, what's the point? well, the point is that we can add alerts to this chart, to send emails, popup on screen, start screaming, whatever. so that now i don't actually need the chart in screen all the time :)
since this alert chart behaves so nice, values = [-1,0,1] to add an alert is just setting it's value >0.5, or value > -0.5 :)
note: aloert is not actually in the script, it has to be added manually using the button. if Pine has a way to add alerts programatically, i couldn't find it
Skrip sumber terbuka
Dalam semangat sebenar TradingView, pencipta skrip ini telah menjadikannya sumber terbuka supaya pedagang dapat menilai dan mengesahkan kefungsiannya. Terima kasih kepada penulis! Walaupun anda boleh menggunakannya secara percuma, ingat bahawa menerbitkan semula kod ini adalah tertakluk kepada Peraturan Dalaman kami.
Penafian
Maklumat dan penerbitan adalah tidak dimaksudkan untuk menjadi, dan tidak membentuk, nasihat untuk kewangan, pelaburan, perdagangan dan jenis-jenis lain atau cadangan yang dibekalkan atau disahkan oleh TradingView. Baca dengan lebih lanjut di Terma Penggunaan.