RSI-2
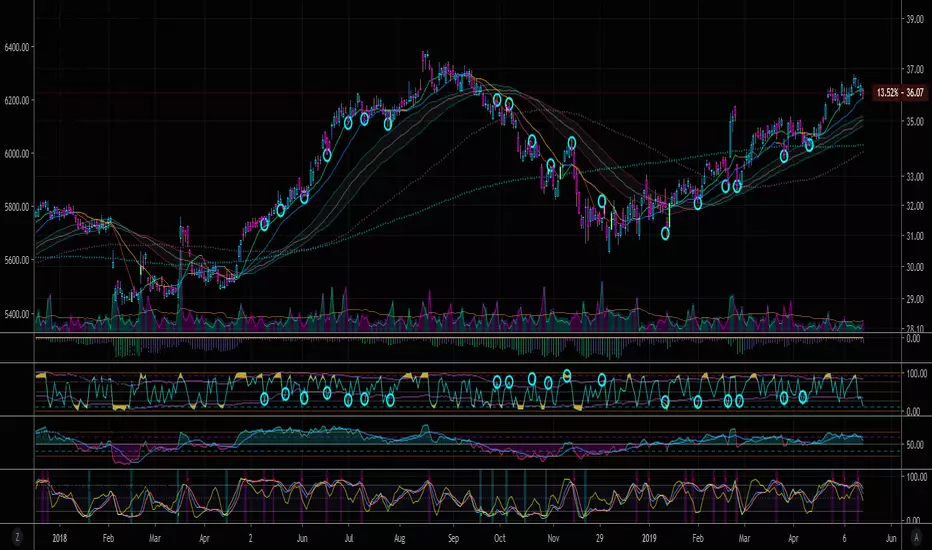
It is used to locate pull back points within a major trend.
These points will generally offer the best risk/reward entry areas.
OB is >90
OS is <10
In an uptrend, long, when RSI-2 is OS
In a downtrend, short, when RSI-2 is OB
Start with 1D chart,
If RSI-2 gives too many signals (false signals) then use higher time frame, such as 3D
If RSi-2 gives not enough signals, then use a lower time frame, such as 3HR
For more information on RSI-2, read "Short term trading strategies that work"-by larry connors, chapter 9
Bollinger bands activated, to fix the prior issue where RSI-2 indicator was not sensitive enough on the current time frame to reach OS (<10) & OB (>90) areas.
With the bolinger bands, it effectively creates a corridor channel to use as OB & OS.
Bolinger band for RSI-2 uses 1 std dev over 31 periods.
traditional bolinger bands are based on: 2 std dev over 20 period ,
tradition TDI is based on: 1.618 std dev over 31 peroids
Skrip jemputan sahaja
Hanya pengguna disahkan oleh penulis boleh mengakses skrip ini. Anda perlu memohon dan mendapatkan kebenaran untuk menggunakannya. Keizinan selalunya diberikan selepas pembayaran. Untuk lebih butiran, ikuti arahan penulis di bawah atau hubungi provalesco secara terus.
TradingView TIDAK menyarankan pembayaran atau penggunaan skrip kecuali anda mempercayai sepenuhnya penulis dan memahami bagaimana ia berfungsi. Anda juga boleh menjumpai alternatif sumber terbuka dan percuma yang lain di dalam skrip komuniti kami.
Arahan penulis
Penafian
Skrip jemputan sahaja
Hanya pengguna disahkan oleh penulis boleh mengakses skrip ini. Anda perlu memohon dan mendapatkan kebenaran untuk menggunakannya. Keizinan selalunya diberikan selepas pembayaran. Untuk lebih butiran, ikuti arahan penulis di bawah atau hubungi provalesco secara terus.
TradingView TIDAK menyarankan pembayaran atau penggunaan skrip kecuali anda mempercayai sepenuhnya penulis dan memahami bagaimana ia berfungsi. Anda juga boleh menjumpai alternatif sumber terbuka dan percuma yang lain di dalam skrip komuniti kami.