OPEN-SOURCE SCRIPT
Telah dikemas kini FFT Signal Analyzer
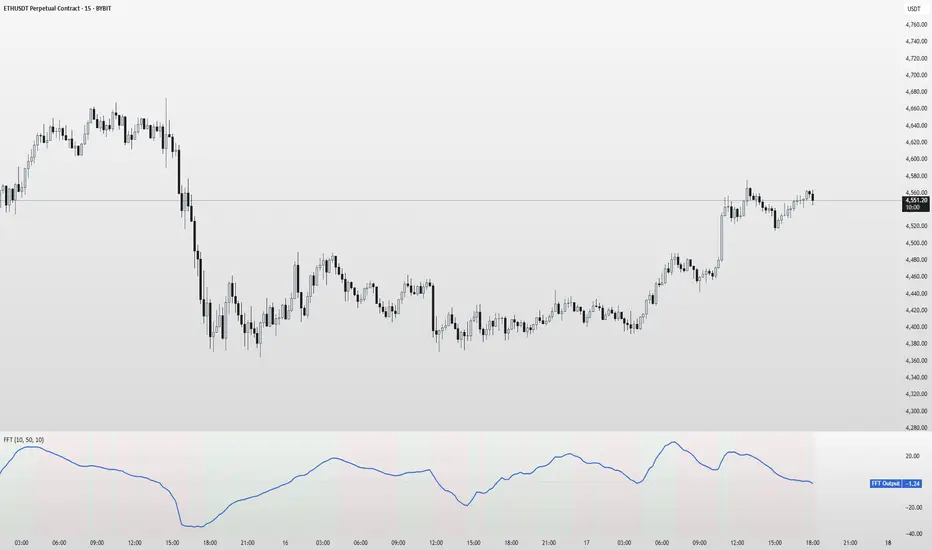
FFT Signal Analyzer
The FFT Signal Analyzer uses a simplified Fast Fourier Transform (FFT) approach to extract dominant cyclical components from price data. By detrending and applying adaptive smoothing, the indicator highlights frequency-driven signals that traditional indicators often miss.
This tool is ideal for traders who want to visualize cyclical market behavior, identify turning points, and confirm entries/exits with frequency-based momentum signals.
How it works:
Removes price trend via detrending (moving average subtraction)
Applies a bandpass filter (EMA) to isolate dominant frequency components
Normalizes the signal using a z-score for consistent visibility
Amplifies the signal for easy interpretation
Highlights slope changes with background coloring (green = rising, red = falling)
Use Cases:
Use zero-line crosses to detect cycle shifts or momentum pivots
Combine with trend filters (e.g., GRJMOM) for high-probability setups
Ideal for detecting underlying rhythm in sideways or oscillating markets
Best for:
Swing traders, scalpers, and cycle analysts looking for frequency-aware confirmation signals
Works on all timeframes and asset classes
Nota Keluaran
FFT Signal AnalyzerOverview:
This indicator applies basic signal processing concepts including detrending and smoothing to create an oscillating signal from price data. The methodology uses moving average-based calculations rather than actual Fast Fourier Transform mathematical operations.
Technical Methodology:
Detrending: Subtracts a moving average from price to remove the underlying trend component
Smoothing Filter: Applies exponential moving average to the detrended signal
Normalization: Uses z-score calculation to standardize the signal amplitude
Amplification: Multiplies the normalized signal by a scaling factor for visual clarity
Slope Analysis: Determines rising or falling direction of the oscillating signal
Visual Elements: Background coloring indicates signal direction
Parameters:
Detrend Length: Period for moving average used in trend removal
Smoothing Length: Period for exponential moving average smoothing
Normalization Length: Lookback period for z-score calculation
Amplification Factor: Multiplier for scaling the final output
Important Clarifications:
This indicator does not perform actual Fast Fourier Transform calculations. True FFT involves complex mathematical computations for frequency domain analysis that cannot be replicated with simple moving average operations. This indicator provides a detrended, smoothed oscillator based on basic signal processing concepts.
Calculation Process:
Price trend is removed using moving average subtraction
Detrended signal is smoothed using exponential moving average
Result is normalized using z-score methodology over a specified lookback period
Final signal is amplified for visual presentation
Technical Limitations:
All calculations are based on historical price data and introduce lag
Detrending effectiveness varies significantly with market conditions
Z-score normalization can produce unstable readings during low volatility periods
Signal quality depends heavily on parameter selection and market characteristics
The indicator does not identify actual frequency components or cycles
Usage Framework:
Zero-line crossings indicate changes in the detrended price momentum
Signal amplitude shows the magnitude of price deviation from trend
Background coloring provides visual reference for oscillator direction
Critical Warnings:
This is not a frequency analysis tool despite the name reference
Does not predict future price movements or identify true market cycles
Should be thoroughly tested across different market conditions before use
Past signal behavior provides no guarantee of future performance
Requires additional analysis methods for trading decision-making
Technical Note:
Users seeking actual frequency domain analysis should understand that true FFT requires mathematical implementations beyond the scope of moving average-based indicators.
Skrip sumber terbuka
Dalam semangat TradingView sebenar, pencipta skrip ini telah menjadikannya sumber terbuka, jadi pedagang boleh menilai dan mengesahkan kefungsiannya. Terima kasih kepada penulis! Walaupuan anda boleh menggunakan secara percuma, ingat bahawa penerbitan semula kod ini tertakluk kepada Peraturan Dalaman.
Penafian
Maklumat dan penerbitan adalah tidak bertujuan, dan tidak membentuk, nasihat atau cadangan kewangan, pelaburan, dagangan atau jenis lain yang diberikan atau disahkan oleh TradingView. Baca lebih dalam Terma Penggunaan.