PROTECTED SOURCE SCRIPT
Telah dikemas kini Stochastic cross up/dn calculator (Picte)
This indicator will calculate the estimated price needed for the stochastic oscillator to change direction. I also included some important horizontal levels for the oscillator. When the oscillator is stuck under the upper purple horizontal we are generally bearish and when it is stuck above the lower blue horizontal we are generally bullish.
The way i like to trade with this oscillator is to see it break a particular support/resistance line and buy/sell it on a retest. I will include some photos of signals i like to take with this indicator below.
I found it useful in the Forex market and also with bitcoin. The traditional market has yet to be tested. I would recommend it being used on time frames above the hourly. It does not mean that lower time frames can not work it is just that higher time frames offer better risk/reward ratio.
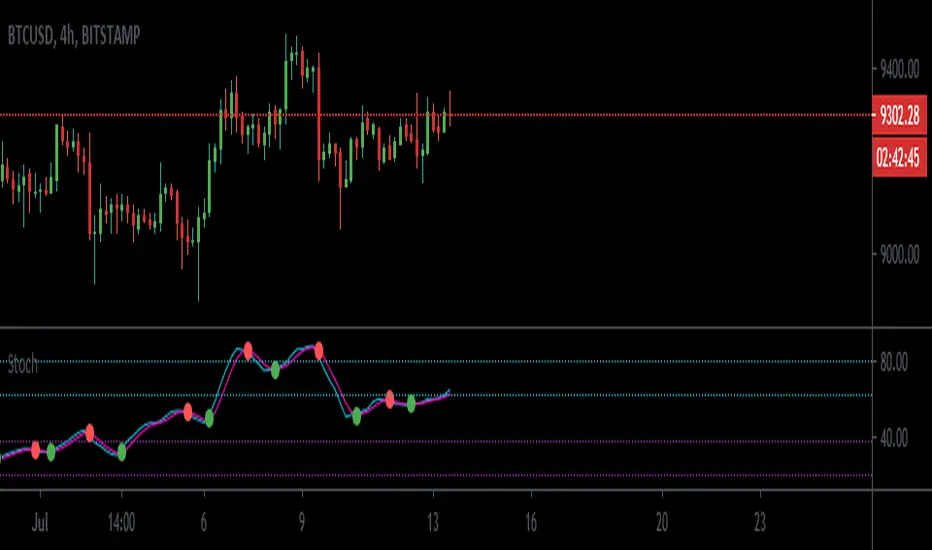
signal examples:

ENJOY :)
The way i like to trade with this oscillator is to see it break a particular support/resistance line and buy/sell it on a retest. I will include some photos of signals i like to take with this indicator below.
I found it useful in the Forex market and also with bitcoin. The traditional market has yet to be tested. I would recommend it being used on time frames above the hourly. It does not mean that lower time frames can not work it is just that higher time frames offer better risk/reward ratio.
signal examples:
ENJOY :)
Nota Keluaran
crosses markedSkrip dilindungi
Skrip ini diterbitkan sebagai sumber tertutup. Akan tetapi, anda boleh menggunakannya secara bebas dan tanpa apa-apa had – ketahui lebih di sini.
Penafian
Maklumat dan penerbitan adalah tidak bertujuan, dan tidak membentuk, nasihat atau cadangan kewangan, pelaburan, dagangan atau jenis lain yang diberikan atau disahkan oleh TradingView. Baca lebih dalam Terma Penggunaan.
Skrip dilindungi
Skrip ini diterbitkan sebagai sumber tertutup. Akan tetapi, anda boleh menggunakannya secara bebas dan tanpa apa-apa had – ketahui lebih di sini.
Penafian
Maklumat dan penerbitan adalah tidak bertujuan, dan tidak membentuk, nasihat atau cadangan kewangan, pelaburan, dagangan atau jenis lain yang diberikan atau disahkan oleh TradingView. Baca lebih dalam Terma Penggunaan.