OPEN-SOURCE SCRIPT
Premarket Hi/Lo + Prior Day O/C Levels
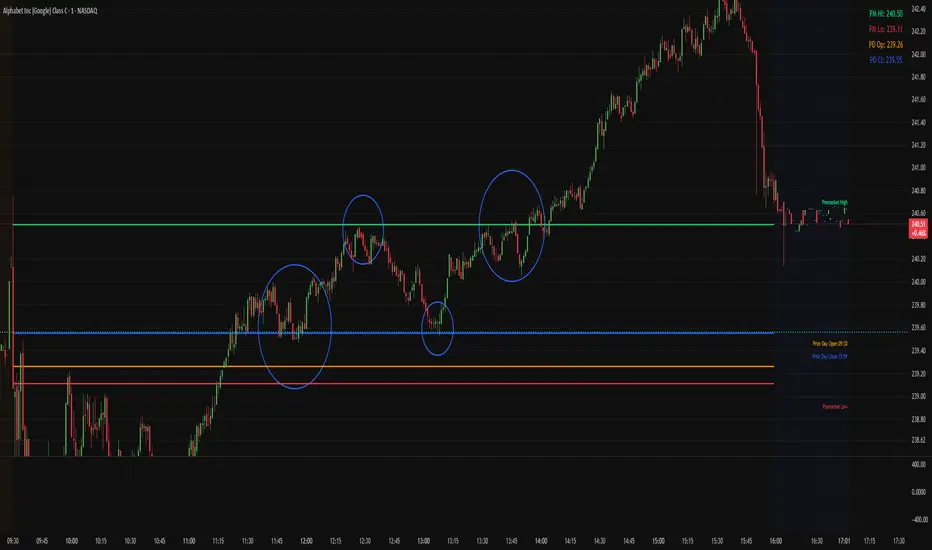
Premarket Hi/Lo + Prior Day O/C (today only) shows four clear reference levels for the current regular trading session: the Premarket High and Premarket Low (taken from a user-defined premarket window, 04:00–09:30 by default) and Yesterday’s 09:30 Open and 15:59 Close (sourced from the 1-minute feed for accuracy). The premarket levels “lock” at the opening bell so they don’t move for the rest of the day. All four lines are displayed only during today’s regular hours to keep the chart focused. Small right-edge labels and an optional top-right mini-table show the exact values at a glance.
This indicator is designed to give immediate context without technical jargon. The premarket high/low summarize where price traveled before the bell; the prior-day open/close summarize where the last session began and ended. Checking whether price is above or below these markers helps you quickly judge strength or weakness and anticipate where price may pause, bounce, or break. Typical uses include watching for a clean break and hold above Premarket High (often bullish), a break and hold below Premarket Low (often bearish), drift back toward Prior Day Close after a gap (a common “magnet”), and flips around Prior Day Open that can lead to continuation.
Setup: Turn on Extended Hours in TradingView so premarket bars are visible (Chart Settings → Symbol → Extended Hours). Apply the indicator to any intraday timeframe. In Inputs, you can change the premarket window to match your market, adjust colors and line widths, and toggle the floating labels and the mini-table. Times use the chart’s exchange time (for US stocks, Eastern Time).
Notes and limits: Lines show only for today’s session (default 09:30–16:00). The script looks at the previous calendar day for “prior day,” so values may be empty after weekends or holidays when markets were closed. If your instrument uses different regular hours or you trade futures/crypto, adjust the premarket session in Inputs and—if needed—edit the regular-hours window in code to match. If your data source does not include premarket, the premarket lines will be blank.
Best practice: The first 15–30 minutes after the open are where these levels have the most impact. Reactions are more meaningful when a line aligns with another tool you use (e.g., VWAP or your opening range). If price does not react clearly at a line, avoid forcing a trade.
Skrip sumber terbuka
Dalam semangat TradingView sebenar, pencipta skrip ini telah menjadikannya sumber terbuka, jadi pedagang boleh menilai dan mengesahkan kefungsiannya. Terima kasih kepada penulis! Walaupuan anda boleh menggunakan secara percuma, ingat bahawa penerbitan semula kod ini tertakluk kepada Peraturan Dalaman.
Penafian
Maklumat dan penerbitan adalah tidak bertujuan, dan tidak membentuk, nasihat atau cadangan kewangan, pelaburan, dagangan atau jenis lain yang diberikan atau disahkan oleh TradingView. Baca lebih dalam Terma Penggunaan.