OPEN-SOURCE SCRIPT
Telah dikemas kini [blackcat] L1 Simplest Sentiment Model
Level 1
Background
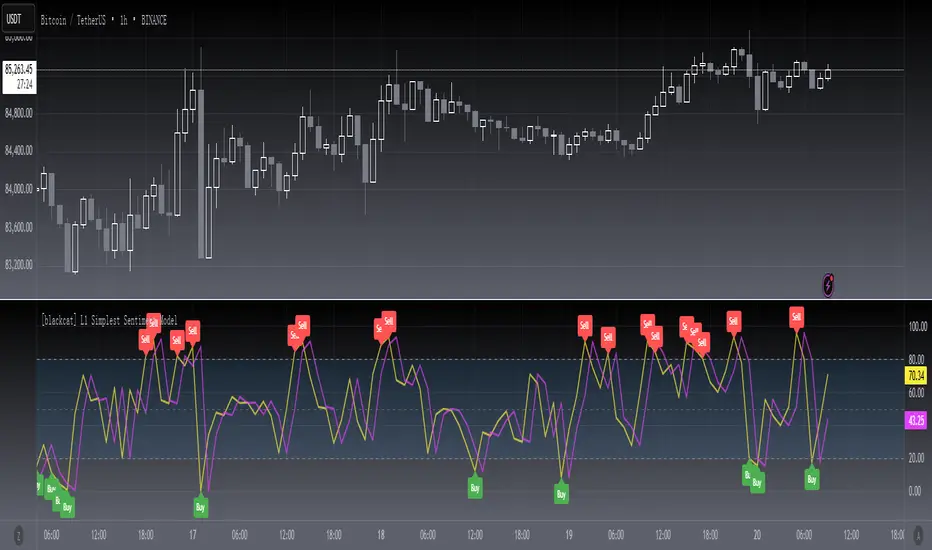
My market sentiment indicator system mainly includes collecting various statistical data and drawing. Again, it was fitted using the OHLC data. This belongs to the latter.
Function
Through a simple calculation, the ratio of high and low breakouts to the price range, we know the sentiment of funds. At the same time, a delay line is used as a trigger signal to judge the inflection point of emotions through the golden fork and the dead fork. Mood thresholds can be defined, such as 20 and 80. This is an oscillator model, but also the simplest indicator of sentiment.
Remarks
Feedbacks are appreciated.
Background
My market sentiment indicator system mainly includes collecting various statistical data and drawing. Again, it was fitted using the OHLC data. This belongs to the latter.
Function
Through a simple calculation, the ratio of high and low breakouts to the price range, we know the sentiment of funds. At the same time, a delay line is used as a trigger signal to judge the inflection point of emotions through the golden fork and the dead fork. Mood thresholds can be defined, such as 20 and 80. This is an oscillator model, but also the simplest indicator of sentiment.
Remarks
Feedbacks are appreciated.
Nota Keluaran
OVERVIEWThe [blackcat] L1 Simplest Sentiment Model provides an easy-to-use sentiment indicator designed to help traders gauge market mood based on recent price movements. This indicator calculates a sentiment value between 0 and 100, plotting it alongside trigger lines and bands to visualize overbought and oversold conditions. It also includes labels and alerts for potential buy and sell opportunities 📈💡.
FEATURES
Calculates a simple sentiment value based on recent highs, lows, and closing prices.
Plots the sentiment value along with a trigger line for visual reference 📊.
Displays upper, middle, and lower bands to highlight overbought and oversold levels:
Upper Band at 80
Middle Band at 50
Lower Band at 20
Adds colored background fill between upper and lower bands for better visualization 🎨.
Generates buy ('Buy') and sell ('Sell') labels on the chart for quick identification 🏷️.
Provides customizable alerts for buy and sell signals 🔔.
HOW TO USE
Add the indicator to your TradingView chart by selecting it from the indicators list.
Monitor the sentiment value plot and observe the labels indicating buy and sell opportunities.
Use the upper, middle, and lower bands as references for overbought and oversold conditions.
Set up alerts based on the generated signals to receive notifications when conditions are met 📲.
Confirm signals with other technical analysis tools before executing trades.
LIMITATIONS
The simplicity of the model may lead to false signals in certain market conditions.
The indicator does not account for external factors influencing market sentiment.
Users should combine this tool with other forms of analysis for more reliable results.
NOTES
Adjust the lookback period for highest highs and lowest lows if necessary.
Test the indicator thoroughly on demo accounts before applying it to live trading 🔍.
Customize colors and styles to match your preferred chart appearance.
Skrip sumber terbuka
Dalam semangat TradingView sebenar, pencipta skrip ini telah menjadikannya sumber terbuka, jadi pedagang boleh menilai dan mengesahkan kefungsiannya. Terima kasih kepada penulis! Walaupuan anda boleh menggunakan secara percuma, ingat bahawa penerbitan semula kod ini tertakluk kepada Peraturan Dalaman.
Avoid losing contact!Don't miss out! The first and most important thing to do is to join my Discord chat now! Click here to start your adventure: discord.com/invite/ZTGpQJq 防止失联,请立即行动,加入本猫聊天群: discord.com/invite/ZTGpQJq
Penafian
Maklumat dan penerbitan adalah tidak bertujuan, dan tidak membentuk, nasihat atau cadangan kewangan, pelaburan, dagangan atau jenis lain yang diberikan atau disahkan oleh TradingView. Baca lebih dalam Terma Penggunaan.