OPEN-SOURCE SCRIPT
200 EMA Trend Direction [Dr.K.C.Prakash]
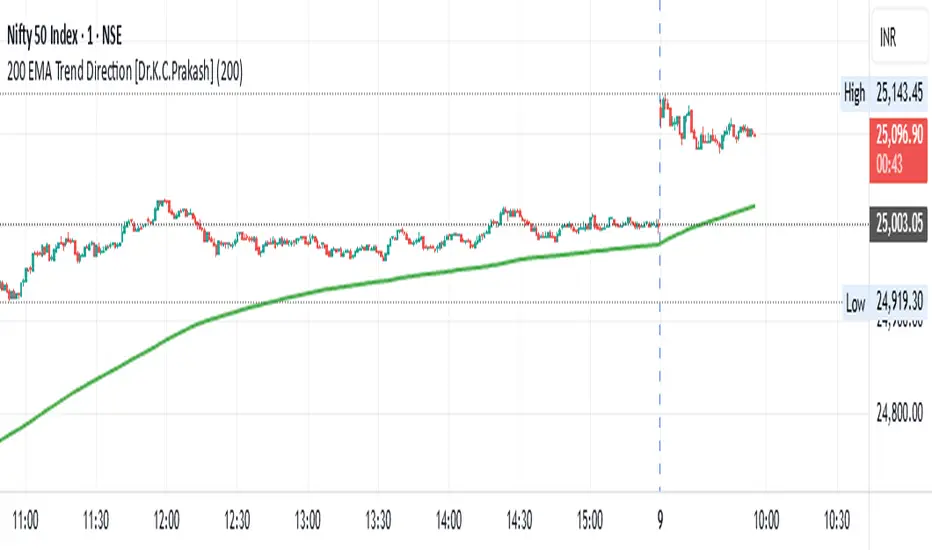
📘 Indicator Description: 200 EMA Trend Direction [Dr.K.C.Prakash]
The "200 EMA Trend Direction [Dr.K.C.Prakash]" indicator is a visual trend-following tool designed to identify and confirm major market direction using the slope of the 200-period Exponential Moving Average (EMA). It’s ideal for traders who want to stay on the right side of the trend and avoid noise.
🔍 Key Components
1. 200 EMA (Exponential Moving Average)
The 200 EMA is a widely used long-term trend indicator in technical analysis.
It reacts faster than the simple moving average (SMA) due to its weighting toward recent prices.
2. Trend Detection Logic
Uptrend is detected when the current EMA value is higher than the previous candle’s EMA.
Downtrend is detected when the EMA starts sloping downward, i.e., current EMA < previous EMA.
🎨 Visual Representation
Green EMA Line: Indicates the 200 EMA is rising → bullish trend (uptrend).
Red EMA Line: Indicates the 200 EMA is falling → bearish trend (downtrend).
This color-coding helps you instantly understand the market context without needing to analyze multiple indicators.
✅ Best Use Cases
📈 Trend Confirmation: Use it to confirm the direction before entering a trade.
⚠️ Avoid Counter-Trend Trades: Helps in staying aligned with the dominant trend.
🧠 Supports All Timeframes: Although best suited for 5m, 15m, or higher, it can also be used for 1-minute charts in scalping systems when aligned with higher timeframes.
⚙️ Customization Possibilities
You can extend this indicator with:
🔔 Trend change alerts
🟩🟥 Background shading based on trend
💹 Buy/Sell signals when price crosses above/below the 200 EMA
Skrip sumber terbuka
Dalam semangat sebenar TradingView, pencipta skrip ini telah menjadikannya sumber terbuka supaya pedagang dapat menilai dan mengesahkan kefungsiannya. Terima kasih kepada penulis! Walaupun anda boleh menggunakannya secara percuma, ingat bahawa menerbitkan semula kod ini adalah tertakluk kepada Peraturan Dalaman kami.
Penafian
Maklumat dan penerbitan adalah tidak dimaksudkan untuk menjadi, dan tidak membentuk, nasihat untuk kewangan, pelaburan, perdagangan dan jenis-jenis lain atau cadangan yang dibekalkan atau disahkan oleh TradingView. Baca dengan lebih lanjut di Terma Penggunaan.