PROTECTED SOURCE SCRIPT
Jags Dynamic S/R with Breakout & Weakness Signals
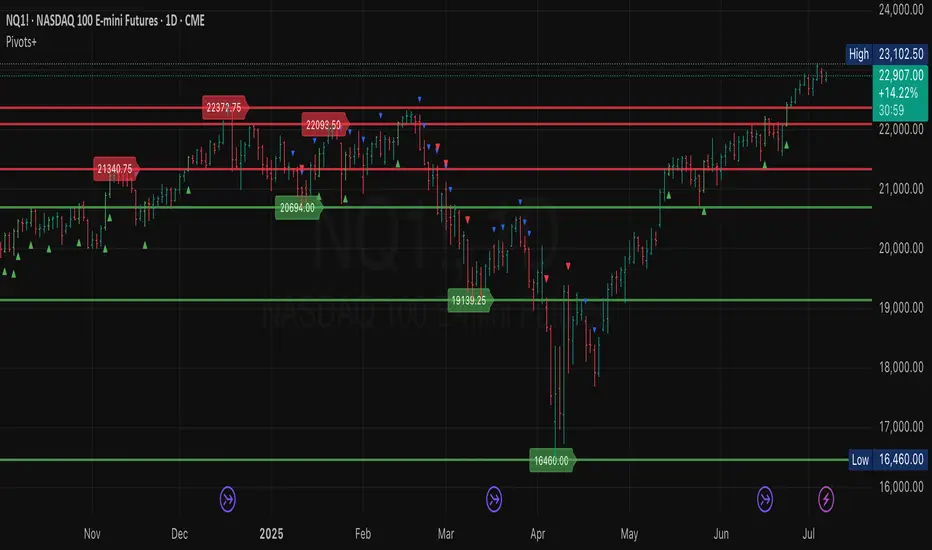
This script is designed to automatically identify and display significant support and resistance levels on your chart. It then goes a step further by actively monitoring for potential breakouts and signs of support weakness.
Core Functionality: Identifying Key Levels
At its heart, the script uses a pivot logic to find recent price highs and lows, which it then plots as horizontal lines representing potential resistance and support, respectively. You have full control over how these levels are identified:
Timeframe: You can choose to find these pivot points on the current chart's timeframe or a higher one (e.g., daily pivots on an hourly chart).
Lookback Period: You can define how many bars to the left and right of a pivot point the script should consider, allowing you to fine-tune the significance of the levels it identifies.
Line Management: To keep your chart clean, you can set the maximum number of support and resistance lines to display. The script also has a clever "merge" feature that combines new pivot levels with existing ones if they are very close together, preventing clutter.
Breakout Detection
A key feature of this indicator is its ability to signal when the price breaks through one of these identified support or resistance levels. You can enable or disable this feature and choose from several confirmation methods to suit your trading style:
Simple Price Action: A breakout is confirmed simply by the price closing above a resistance level or below a support level.
ATR (Average True Range): For a breakout to be valid, the price must close a certain distance (based on the ATR) beyond the level, filtering out minor fluctuations.
Volume: This option adds another layer of confirmation by requiring a significant increase in trading volume during the breakout, suggesting strong conviction behind the move.
Momentum: This method uses the RSI (Relative Strength Index) to confirm that the breakout is supported by strong underlying momentum.
Quantitative: A more advanced option that uses a combination of the Rate of Change (ROC) and a Volume-Weighted Moving Average (VWMA) to provide a robust, multi-faceted confirmation of the breakout.
When a confirmed breakout occurs, the script will:
Color the breakout bar green for a bullish breakout (upward) or red for a bearish breakout (downward).
Place an arrow below a bullish breakout or above a bearish breakout.
Trigger an alert to notify you of the event.
Support Weakness Detection
To provide an early warning of a potential breakdown, the script includes a unique "Support Weakness Detection" feature. When enabled, it looks for a specific confluence of bearish signals as the price approaches a support level:
The price is hovering just above a key support level.
The short-term trend has already turned bearish (based on a moving average).
Momentum is fading (indicated by a falling RSI).
If all these conditions are met, a blue down-arrow will appear above the price bar, signalling that the nearby support may not hold.
Skrip dilindungi
Skrip ini diterbitkan sebagai sumber tertutup. Akan tetapi, anda boleh menggunakannya secara bebas dan tanpa apa-apa had – ketahui lebih di sini.
Penafian
Maklumat dan penerbitan adalah tidak bertujuan, dan tidak membentuk, nasihat atau cadangan kewangan, pelaburan, dagangan atau jenis lain yang diberikan atau disahkan oleh TradingView. Baca lebih dalam Terma Penggunaan.