PROTECTED SOURCE SCRIPT
[N]RSIOMA
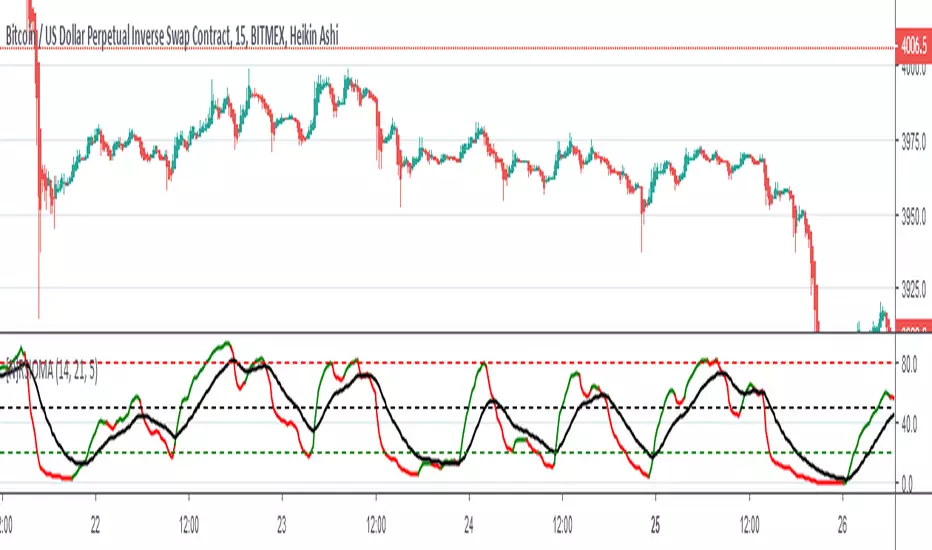
RSIOMA is the abbreviation for Relative Strength index (RSI) of moving averages (MA).
Rules:
RSI above MA and RSI above level 50 is a signal of a bullish trend. RSI below MA and RSI below level 50 is a signal of a bearish trend.
One can also buy when the RSI breaks level 20 from below and sell when RSI breaks level 80 from above
Tip 1: Look out for bounces. When RSI line bounces off from MA line it means the trend will likely continue;
Tip 2: Look out for support / resistance of RSI LINE.
Tip 3: USE as follow = higher timeframe to lower timeframe
Skrip dilindungi
Skrip ini diterbitkan sebagai sumber tertutup. Akan tetapi, anda boleh menggunakannya dengan percuma dan tanpa had – ketahui lebih lanjut di sini.
Penafian
Maklumat dan penerbitan adalah tidak dimaksudkan untuk menjadi, dan tidak membentuk, nasihat untuk kewangan, pelaburan, perdagangan dan jenis-jenis lain atau cadangan yang dibekalkan atau disahkan oleh TradingView. Baca dengan lebih lanjut di Terma Penggunaan.