PROTECTED SOURCE SCRIPT
Advanced Standard Deviation EMAs
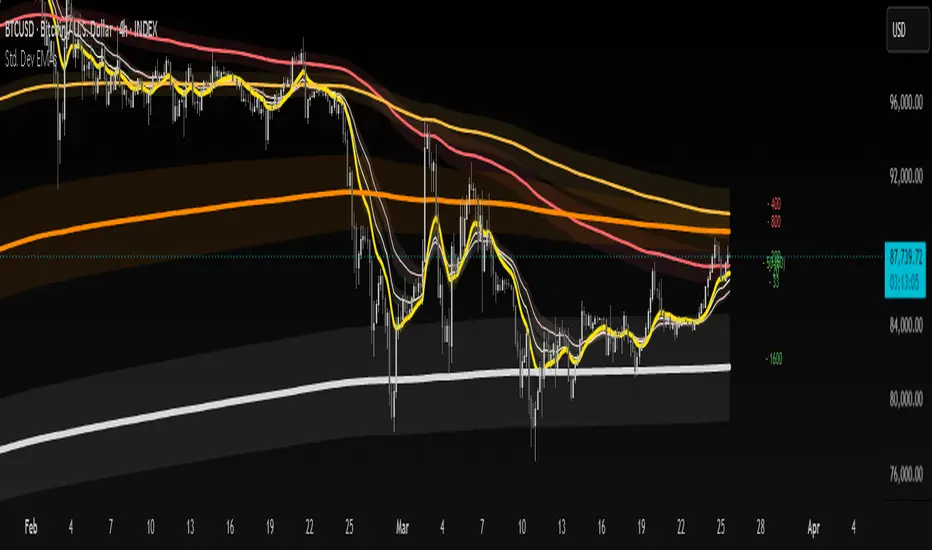
📊 Advanced Standard Deviation EMAs Indicator
This indicator plots up to 7 customizable EMAs with standard deviation channels which helps traders see the potential levels surrounding the EMAs that accounts for recent volatility.
📈 What is Standard Deviation?
Standard deviation is a statistical measure that quantifies the amount of variation or dispersion in a set of values. In trading, it measures how much price movement deviates from the average (mean) price over a specific period. Higher standard deviation indicates higher volatility, while lower values suggest more consistent price action. When applied to EMAs, standard deviation channels help traders identify when price is behaving normally versus when it's making extraordinary moves, potentially signaling trading opportunities or increased risk.
- - - - - - -
✨ Key Features
- Highly Customizable: Each EMA can be independently configured for maximum flexibility
- Multi-Timeframe Analysis: Each EMA can calculate on its own timeframe while displayed on the same chart
- Adaptive Labels: Smart labels show period, timeframe, and trend direction
- Visual Clarity: Fully customizable colors, transparency, and visual elements
🛠️ Per-EMA Customization
Each of the 7 EMAs offers individual control over:
- 📏 Period Length: Set your preferred EMA calculation period
- ⏱️ Timeframe: Calculate each EMA on its own timeframe (defaults to chart timeframe)
- 📏 Standard Deviation Multiplier: Fine-tune channel width with individual multipliers
- 🎨 Colors: Custom colors for lines, fills, and labels
- 🔍 Visibility: Toggle line, fill, and label visibility independently
- 🌫️ Transparency: Adjust fill transparency for each Standard Deviation Channel
🏷️ Smart Labels
Labels automatically display:
1. EMA length (e.g., "- 200")
2. Calculation timeframe when custom (e.g., "- 200 (240)")
3. Trend direction through color
Label colors indicate trend direction:
- 🟢 Green: EMA is trending upward (customizable)
- 🔴 Red: EMA is trending downward (customizable)
⚙️ Global Settings
- Label Offset: Position labels away from price action (default: 20 bars)
- Label Size: Choose from multiple text sizes
- Quick Toggle: Disable all EMA lines and fills with one click while keeping labels
💡 Use Cases
- Multi-timeframe trend analysis
- Dynamic support/resistance identification
- Price volatility assessment
- Trend strength confirmation
- - - - - -
Comment down below if you have any cool feature ideas or want to show your support and give this indicator a like if you're enjoying it :)
Enjoy!
SS
Skrip dilindungi
Skrip ini diterbitkan sebagai sumber tertutup. Akan tetapi, anda boleh menggunakannya secara bebas dan tanpa apa-apa had – ketahui lebih di sini.
Penafian
Maklumat dan penerbitan adalah tidak bertujuan, dan tidak membentuk, nasihat atau cadangan kewangan, pelaburan, dagangan atau jenis lain yang diberikan atau disahkan oleh TradingView. Baca lebih dalam Terma Penggunaan.