PROTECTED SOURCE SCRIPT
Maat LOW HIGH Order

Welcome to Maat LOW HIGH Order
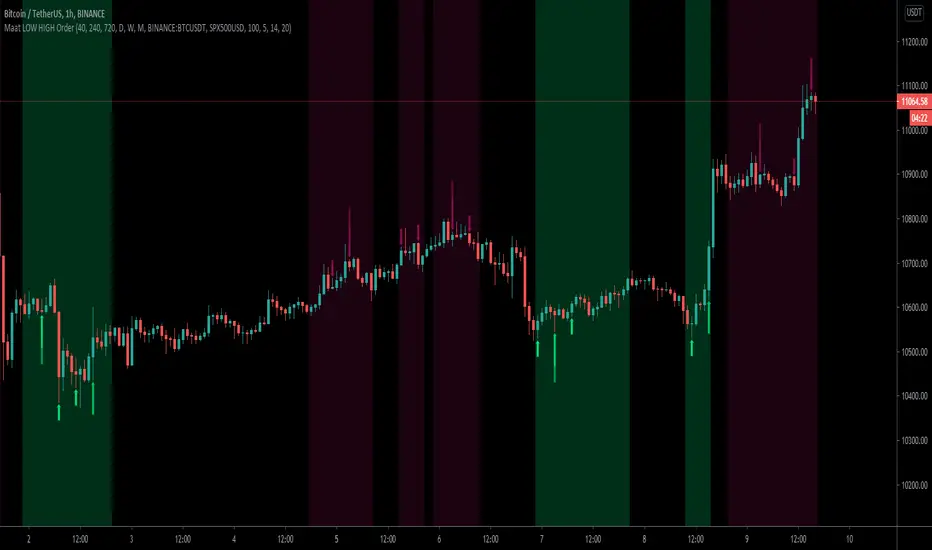
Maat LOW HIGH Order is an oscillator based on volume weighted RSI and it can show local lows quite nicely (green arrows). The red arrows can indicate a local overbought area and can be uses as a sell or take profit signal. The length of the arrow is defined by the time frame. Highest time frame -> longest arrow. Arrows can also overlap to indicate a stronger signal.
Shorting on red arrows is not reliable yet.
Huge part is the multi time frame addition, so you can get a confirmation from multiple time frames on one screen.
Check the settings I used for 1h chart. Lower TF also possible, just change the settings accordingly.
To make this even more precise I incorporated my HORUS script as a filter. The HORUS checks the spread of two tickers and may indicate oversold / overbought conditions compared to one or the other (Eg. BTCUSD and SPX500).
That way you will only see green / red arrows when HORUS is also showing some overbought / oversold signs.
Use other indicators and PA for more confluence.
Wuuzzaa
Skrip dilindungi
Skrip ini diterbitkan sebagai sumber tertutup. However, you can use it freely and without any limitations – learn more here.
Penafian
The information and publications are not meant to be, and do not constitute, financial, investment, trading, or other types of advice or recommendations supplied or endorsed by TradingView. Read more in the Terms of Use.