Summit Line
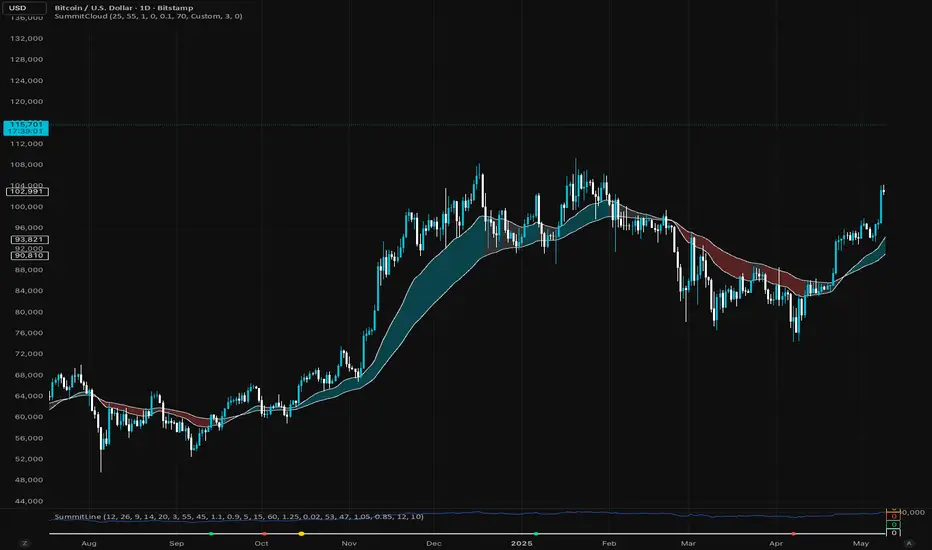
It blends MACD, RSI, moving averages and Volume Strength, giving traders a real time gauge of momentum shifts and exhaustion points.
🟢 Green Dot: Bullish confluence
🔴 Red Dot: Bearish confluence
🟡 Gold Dot: “A+” setup, rare alignment of all core metrics, typically at high-probability reversal or breakout zones.
Unlike noisy indicators, Summit Line filters weak signals using RSI slope, volume surges, and EMA trend structure, keeping the chart clean and accurate.
Every dot is pinned along a flat zero baseline for visual simplicity, ideal for combining with the Summit cloud or other price overlays.
Skrip jemputan sahaja
Hanya pengguna disahkan oleh penulis boleh mengakses skrip ini. Anda perlu memohon dan mendapatkan kebenaran untuk menggunakannya. Keizinan selalunya diberikan selepas pembayaran. Untuk lebih butiran, ikuti arahan penulis di bawah atau hubungi jedhucker secara terus.
TradingView TIDAK menyarankan pembayaran atau penggunaan skrip kecuali anda mempercayai sepenuhnya penulis dan memahami bagaimana ia berfungsi. Anda juga boleh menjumpai alternatif sumber terbuka dan percuma yang lain di dalam skrip komuniti kami.
Arahan penulis
Penafian
Skrip jemputan sahaja
Hanya pengguna disahkan oleh penulis boleh mengakses skrip ini. Anda perlu memohon dan mendapatkan kebenaran untuk menggunakannya. Keizinan selalunya diberikan selepas pembayaran. Untuk lebih butiran, ikuti arahan penulis di bawah atau hubungi jedhucker secara terus.
TradingView TIDAK menyarankan pembayaran atau penggunaan skrip kecuali anda mempercayai sepenuhnya penulis dan memahami bagaimana ia berfungsi. Anda juga boleh menjumpai alternatif sumber terbuka dan percuma yang lain di dalam skrip komuniti kami.