OPEN-SOURCE SCRIPT
Telah dikemas kini ATR and Volume Analysis
Hi!
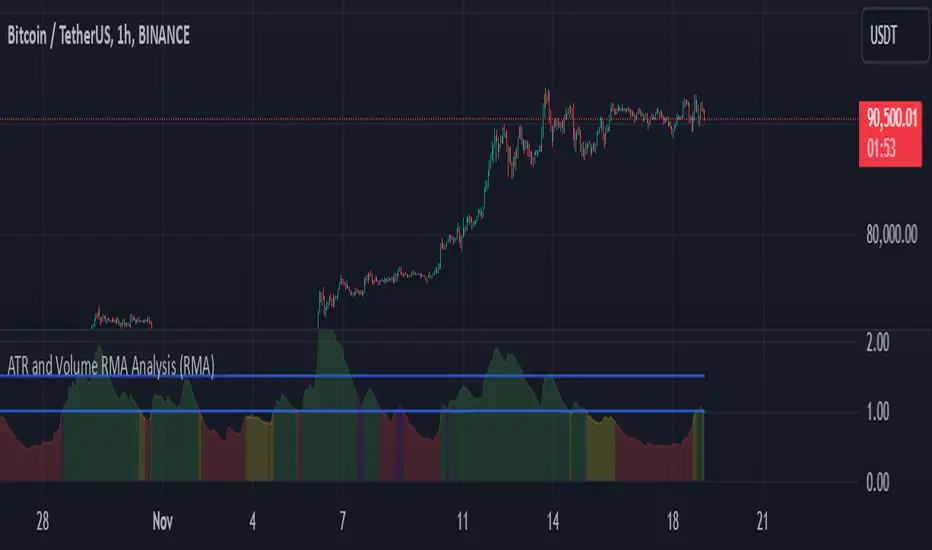
I would like to present an indicator that's meant to measure ratio of Volatility to Volume.
Basically it measures 2 moving averages (14 and 100 period) of ATR and Volume and then compares them. The output is ATR14 / Vol14
Color scheme
Red: Volume and ATR is both below 14 period
Green: Both are above
Yellow: Volume up, volatility down
Purple: Volume down, volatility up
Then there are two lines - 1 and 1.5
That is, in my opinion, the most optimal state to trade, because 1 means that there is some volatility and it's confirmed by volume. Above 1,5 you could see it as overbought (or oversold) zone. If it's above this line, we could expect a retracement since the volatility is not backed by volume. Above 2 it's quite critical and I would suggest closing trades.
(You can use it across all timeframes. In fact it's better if you do so. Longer timeframes are good for spotting tradeable markets while shorter timeframes show overbought / oversold zones)
I have also added option to choose between 4 different moving averages, but in my opinion RMA works the best.
Feel free to share some feedback, I would really appreciate it.
Sincerely,
Beefmaster
Nota Keluaran
Update: Removed other indicators to match the house rules.Skrip sumber terbuka
Dalam semangat TradingView sebenar, pencipta skrip ini telah menjadikannya sumber terbuka, jadi pedagang boleh menilai dan mengesahkan kefungsiannya. Terima kasih kepada penulis! Walaupuan anda boleh menggunakan secara percuma, ingat bahawa penerbitan semula kod ini tertakluk kepada Peraturan Dalaman.
Penafian
Maklumat dan penerbitan adalah tidak bertujuan, dan tidak membentuk, nasihat atau cadangan kewangan, pelaburan, dagangan atau jenis lain yang diberikan atau disahkan oleh TradingView. Baca lebih dalam Terma Penggunaan.
Skrip sumber terbuka
Dalam semangat TradingView sebenar, pencipta skrip ini telah menjadikannya sumber terbuka, jadi pedagang boleh menilai dan mengesahkan kefungsiannya. Terima kasih kepada penulis! Walaupuan anda boleh menggunakan secara percuma, ingat bahawa penerbitan semula kod ini tertakluk kepada Peraturan Dalaman.
Penafian
Maklumat dan penerbitan adalah tidak bertujuan, dan tidak membentuk, nasihat atau cadangan kewangan, pelaburan, dagangan atau jenis lain yang diberikan atau disahkan oleh TradingView. Baca lebih dalam Terma Penggunaan.