PROTECTED SOURCE SCRIPT
Telah dikemas kini Daily Gain/Loss Statistics by Day of Week
Daily Gain/Loss Statistics by Day of Week
Overview
This Pine Script indicator analyzes historical price data to provide comprehensive day-of-week performance statistics, helping traders identify patterns and optimize their trading strategies based on which days historically perform better or worse.
Key Features
📊 Day-of-Week Analysis
7-day breakdown showing Monday through Sunday statistics
Average Gain % - Average percentage gains on winning days for each day of the week
Average Loss % - Average percentage losses on losing days (displayed with minus sign)
Median High % - Typical percentage move from open to daily high
Median Low % - Typical percentage move from open to daily low
🎯 Visual Performance Indicators
🚀 Rocket symbol - Marks the best performing day (highest average gains)
🔻 Red triangle down - Marks the worst performing day (lowest average gains)
Current day highlighting - Today's row highlighted in yellow (#ffdd444b)
⚡ Real-Time Session Tracking
Current Session row - Shows today's performance percentage in real-time
Color-coded gains/losses - Green for positive, red for negative
🎨 Professional Themes
⚙️ Customization Options
Date range selection - Choose specific time periods for analysis
Table positioning - 9 different screen positions
Table sizing - 6 size options from tiny to huge
Timeframe protection - Works only on 1D timeframe with user-friendly warnings
How It Works
Data Collection - Analyzes daily OHLC data within your selected date range
Day Classification - Categorizes each trading day by day of the week
Statistical Calculation - Computes averages and medians for each day type
Performance Ranking - Identifies best and worst performing days
Real-Time Display - Shows current session performance vs historical patterns
Trading Applications
Entry/Exit Timing - Identify optimal days for opening/closing positions
Risk Management - Avoid trading on historically poor-performing days
Strategy Optimization - Align trading strategies with day-of-week patterns
Market Timing - Understand weekly market cycles and seasonality
This indicator transforms raw price data into actionable intelligence, helping traders make more informed decisions based on proven historical day-of-week performance patterns.
Nota Keluaran
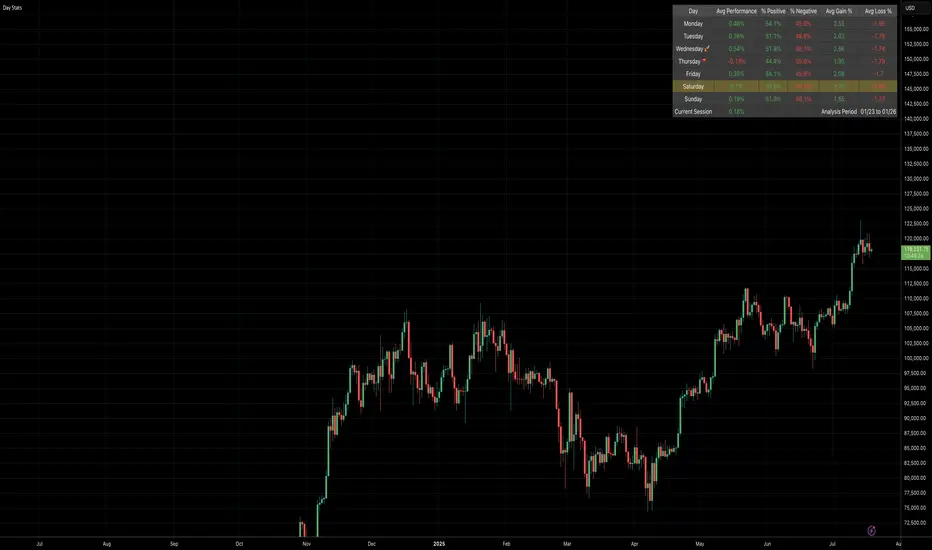
Added "Analysis Period" into the table so you can easily identify the rangeNota Keluaran
🎯 Core Statistics Displayed:1. Best/Worst Day Indicators:
🚀 Rocket: Day with highest overall average performance
🔻 Red Triangle: Day with lowest overall average performance
Based on net average daily performance (gains + losses combined)
2. Essential Columns (Default ON):
Day: Day of week with performance indicators
Avg Performance: Net daily performance including all gains/losses
% Positive: Percentage of time each day ends positive
% Negative: Percentage of time each day ends negative
Avg Gain %: Average gain when day is positive
Avg Loss %: Average loss when day is negative
3. Optional Intraday Columns (Default OFF):
Median High %: Median daily high vs open
Median Low %: Median daily low vs open
Nota Keluaran
.Skrip dilindungi
Skrip ini diterbitkan sebagai sumber tertutup. Akan tetapi, anda boleh menggunakannya secara bebas dan tanpa apa-apa had – ketahui lebih di sini.
Penafian
Maklumat dan penerbitan adalah tidak bertujuan, dan tidak membentuk, nasihat atau cadangan kewangan, pelaburan, dagangan atau jenis lain yang diberikan atau disahkan oleh TradingView. Baca lebih dalam Terma Penggunaan.
Skrip dilindungi
Skrip ini diterbitkan sebagai sumber tertutup. Akan tetapi, anda boleh menggunakannya secara bebas dan tanpa apa-apa had – ketahui lebih di sini.
Penafian
Maklumat dan penerbitan adalah tidak bertujuan, dan tidak membentuk, nasihat atau cadangan kewangan, pelaburan, dagangan atau jenis lain yang diberikan atau disahkan oleh TradingView. Baca lebih dalam Terma Penggunaan.