OPEN-SOURCE SCRIPT
Pro Bollinger Bands Calculator
The "Pro Bollinger Bands Calculator" indicator joins our suite of custom trading tools, which includes the "Pro Supertrend Calculator", the "Pro RSI Calculator" and the "Pro Momentum Calculator."
Expanding on this series, the "Pro Bollinger Bands Calculator" is tailored to offer traders deeper insights into market dynamics by harnessing the power of the Bollinger Bands indicator.
Its core mission remains unchanged: to scrutinize historical price data and provide informed predictions about future price movements, with a specific focus on detecting potential bullish (green) or bearish (red) candlestick patterns.
1. Bollinger Bands Calculation:
The indicator kicks off by computing the Bollinger Bands, a well-known volatility indicator. It calculates two pivotal Bollinger Bands parameters:
- Bollinger Bands Length: This parameter sets the lookback period for Bollinger Bands calculations.
- Bollinger Bands Deviation: It determines the deviation multiplier for the upper and lower bands, typically set at 2.0.
2. Visualizing Bollinger Bands:
The Bollinger Bands derived from the calculations are skillfully plotted on the price chart:
- Red Line: Represents the upper Bollinger Band during bearish trends, suggesting potential price declines.
- Teal Line: Represents the lower Bollinger Band in bullish market conditions, signaling the possibility of price increases.
3.Analyzing Consecutive Candlesticks:
The indicator's core functionality revolves around tracking consecutive candlestick patterns based on their relationship with the Bollinger Bands lines. To be considered for analysis, a candlestick must consistently close either above (green candles) or below (red candles) the Bollinger Bands lines for multiple consecutive periods.
4. Labeling and Enumeration:
To convey the count of consecutive candles displaying consistent trend behavior, the indicator meticulously assigns labels to the price chart. The position of these labels varies depending on the direction of the trend, appearing either below (for bullish patterns) or above (for bearish patterns) the candlesticks. The label colors match the candle colors: green labels for bullish candles and red labels for bearish ones.
5. Tabular Data Presentation:
The indicator complements its graphical analysis with a customizable table that prominently displays comprehensive statistical insights. Key data points within the table encompass:
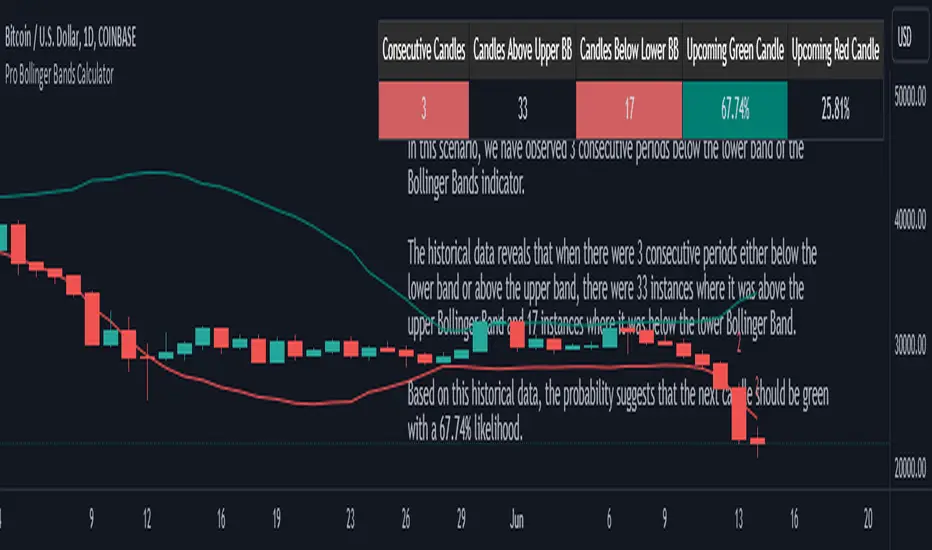
- Consecutive Candles: The count of consecutive candles displaying consistent trend characteristics.
- Candles Above Upper BB: The number of candles closing above the upper Bollinger Band during the consecutive period.
- Candles Below Lower BB: The number of candles closing below the lower Bollinger Band during the consecutive period.
- Upcoming Green Candle: An estimated probability of the next candlestick being bullish, derived from historical data.
- Upcoming Red Candle: An estimated probability of the next candlestick being bearish, also based on historical data.
6. Custom Configuration:
To cater to diverse trading strategies and preferences, the indicator offers extensive customization options. Traders can fine-tune parameters such as Bollinger Bands length, upper and lower band deviations, label and table placement, and table size to align with their unique trading approaches.
Expanding on this series, the "Pro Bollinger Bands Calculator" is tailored to offer traders deeper insights into market dynamics by harnessing the power of the Bollinger Bands indicator.
Its core mission remains unchanged: to scrutinize historical price data and provide informed predictions about future price movements, with a specific focus on detecting potential bullish (green) or bearish (red) candlestick patterns.
1. Bollinger Bands Calculation:
The indicator kicks off by computing the Bollinger Bands, a well-known volatility indicator. It calculates two pivotal Bollinger Bands parameters:
- Bollinger Bands Length: This parameter sets the lookback period for Bollinger Bands calculations.
- Bollinger Bands Deviation: It determines the deviation multiplier for the upper and lower bands, typically set at 2.0.
2. Visualizing Bollinger Bands:
The Bollinger Bands derived from the calculations are skillfully plotted on the price chart:
- Red Line: Represents the upper Bollinger Band during bearish trends, suggesting potential price declines.
- Teal Line: Represents the lower Bollinger Band in bullish market conditions, signaling the possibility of price increases.
3.Analyzing Consecutive Candlesticks:
The indicator's core functionality revolves around tracking consecutive candlestick patterns based on their relationship with the Bollinger Bands lines. To be considered for analysis, a candlestick must consistently close either above (green candles) or below (red candles) the Bollinger Bands lines for multiple consecutive periods.
4. Labeling and Enumeration:
To convey the count of consecutive candles displaying consistent trend behavior, the indicator meticulously assigns labels to the price chart. The position of these labels varies depending on the direction of the trend, appearing either below (for bullish patterns) or above (for bearish patterns) the candlesticks. The label colors match the candle colors: green labels for bullish candles and red labels for bearish ones.
5. Tabular Data Presentation:
The indicator complements its graphical analysis with a customizable table that prominently displays comprehensive statistical insights. Key data points within the table encompass:
- Consecutive Candles: The count of consecutive candles displaying consistent trend characteristics.
- Candles Above Upper BB: The number of candles closing above the upper Bollinger Band during the consecutive period.
- Candles Below Lower BB: The number of candles closing below the lower Bollinger Band during the consecutive period.
- Upcoming Green Candle: An estimated probability of the next candlestick being bullish, derived from historical data.
- Upcoming Red Candle: An estimated probability of the next candlestick being bearish, also based on historical data.
6. Custom Configuration:
To cater to diverse trading strategies and preferences, the indicator offers extensive customization options. Traders can fine-tune parameters such as Bollinger Bands length, upper and lower band deviations, label and table placement, and table size to align with their unique trading approaches.
Skrip sumber terbuka
Dalam semangat sebenar TradingView, pencipta skrip ini telah menjadikannya sumber terbuka supaya pedagang dapat menilai dan mengesahkan kefungsiannya. Terima kasih kepada penulis! Walaupun anda boleh menggunakannya secara percuma, ingat bahawa menerbitkan semula kod ini adalah tertakluk kepada Peraturan Dalaman kami.
The trend is your friend, until it's not...
Penafian
Maklumat dan penerbitan adalah tidak dimaksudkan untuk menjadi, dan tidak membentuk, nasihat untuk kewangan, pelaburan, perdagangan dan jenis-jenis lain atau cadangan yang dibekalkan atau disahkan oleh TradingView. Baca dengan lebih lanjut di Terma Penggunaan.