OPEN-SOURCE SCRIPT
Fisher Transform Strategy
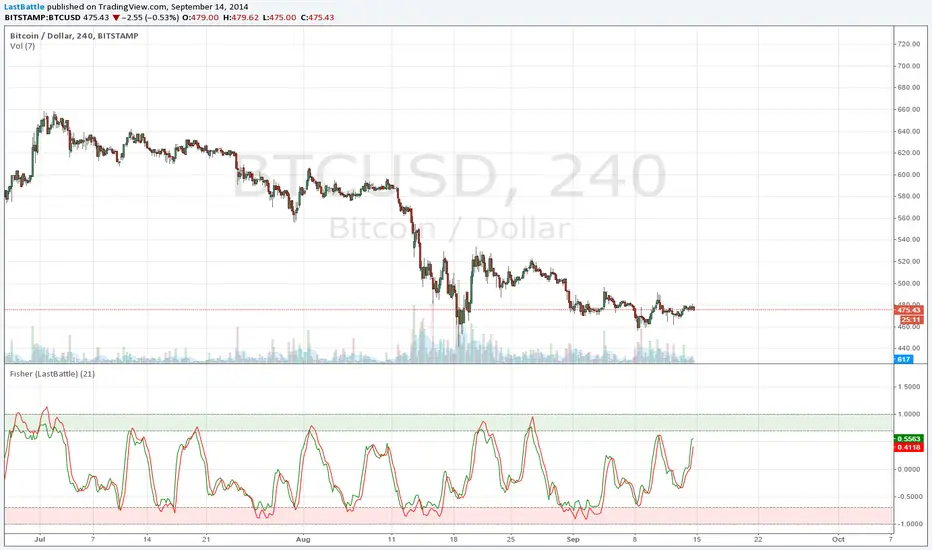
Direct port of the original Fisher Transform to TradingView: media.johnwiley.com.au/product_data/excerpt/78/04714630/0471463078.pdf
mesasoftware.com/Seminars/TradeStation World 04.pdf
This might be better suited to be combined with other indicator to be effective, such as the Fisher Transform of RSI.
I hope you have found this useful :) Happy trading.
Thanks to MikeLloyd for referring me to this, and here's my port for you.
mesasoftware.com/Seminars/TradeStation World 04.pdf
This might be better suited to be combined with other indicator to be effective, such as the Fisher Transform of RSI.
I hope you have found this useful :) Happy trading.
Thanks to MikeLloyd for referring me to this, and here's my port for you.
Skrip sumber terbuka
Dalam semangat sebenar TradingView, pencipta skrip ini telah menjadikannya sumber terbuka supaya pedagang dapat menilai dan mengesahkan kefungsiannya. Terima kasih kepada penulis! Walaupun anda boleh menggunakannya secara percuma, ingat bahawa menerbitkan semula kod ini adalah tertakluk kepada Peraturan Dalaman kami.
Penafian
Maklumat dan penerbitan adalah tidak dimaksudkan untuk menjadi, dan tidak membentuk, nasihat untuk kewangan, pelaburan, perdagangan dan jenis-jenis lain atau cadangan yang dibekalkan atau disahkan oleh TradingView. Baca dengan lebih lanjut di Terma Penggunaan.