PROTECTED SOURCE SCRIPT
Telah dikemas kini Vasyl Ivanov | Support & Resistance Zones
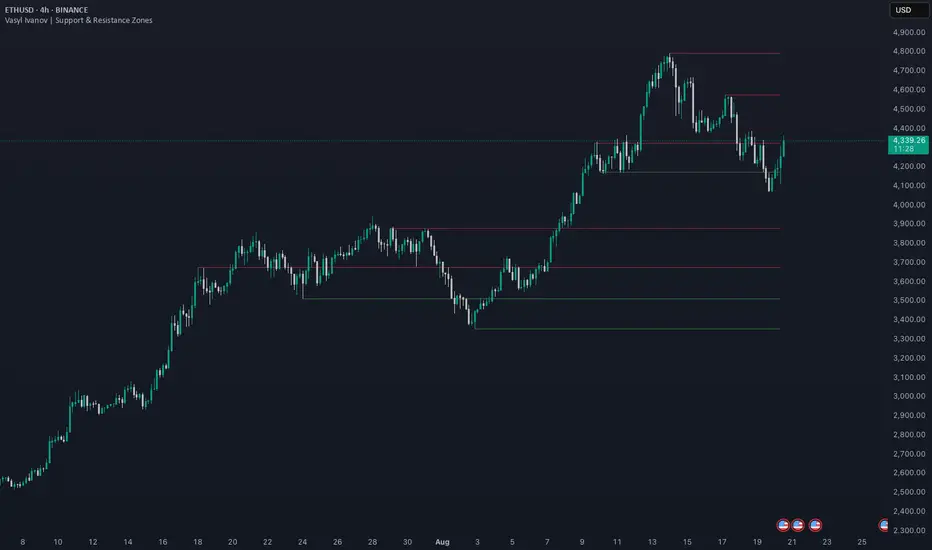
Support and Resistance Zones Indicator: Multi-Timeframe Detection
This indicator helps traders identify key Support and Resistance zones across multiple timeframes. With customizable settings for zone visibility, color coding, and granularity, it allows for flexible market analysis and adapts to different trading styles.
Key Features:
How It Works:
The Support and Resistance Zones Indicator analyzes price data to highlight important zones where price has historically reacted:
Use Cases:
Why It’s Unique:
This indicator offers a comprehensive, customizable approach to identifying support and resistance zones across multiple timeframes, with the added flexibility of ATR-based granularity and zone visibility control. It’s ideal for traders who want deeper insight into potential reversal points while keeping their charts visually manageable.
This indicator helps traders identify key Support and Resistance zones across multiple timeframes. With customizable settings for zone visibility, color coding, and granularity, it allows for flexible market analysis and adapts to different trading styles.
Key Features:
- Support and Resistance Zones for Up to 4 Timeframes:
Detect and display support and resistance zones from up to 4 different timeframes, giving you a comprehensive view of potential reversal points across multiple market levels. - Customizable Colors for Each Timeframe:
Assign a unique color to each timeframe's zones to easily distinguish them on the chart. You can also switch off unnecessary timeframes to keep your chart focused and clutter-free. - Adjustable ATR Coefficient for Granularity:
Modify the ATR coefficient to control the precision of support and resistance zones. A higher coefficient will capture broader zones, while a lower coefficient will reveal more specific levels of support and resistance. - Control Zones' Vertical Distance Visibility:
Adjust the vertical distance visibility of the zones to fine-tune how far each zone extends on the chart, allowing you to better visualize their importance and proximity to current price action.
How It Works:
The Support and Resistance Zones Indicator analyzes price data to highlight important zones where price has historically reacted:
- Select up to 4 timeframes to display support and resistance zones, which will be automatically drawn on your chart.
- Adjust the ATR coefficient to fine-tune the size and granularity of the detected zones.
- Customize zone colors to visually differentiate between timeframes, making it easier to analyze zones from various market levels.
- Control zone visibility by adjusting the vertical distance each zone covers, helping you focus on the most relevant zones for your trading strategy.
Use Cases:
- Multi-Timeframe Support and Resistance: Identify key zones from multiple timeframes to gain insight into potential price reactions and trend reversals.
- Refined Analysis: Adjust the ATR coefficient and visibility settings to adapt the zones to current market volatility, ensuring precise trading decisions.
- Custom Charting: Use different colors for each timeframe to keep your chart organized and visually clear, or turn off timeframes you don’t need for a cleaner view.
Why It’s Unique:
This indicator offers a comprehensive, customizable approach to identifying support and resistance zones across multiple timeframes, with the added flexibility of ATR-based granularity and zone visibility control. It’s ideal for traders who want deeper insight into potential reversal points while keeping their charts visually manageable.
Nota Keluaran
Added options:- Show/hide extremums
- Zones intersection gap
Nota Keluaran
Improved speed of zones detection on higher timeframesNota Keluaran
Now SR lines used instead of wide zones. Nota Keluaran
Improved zones and wicks intersection detectionNota Keluaran
Prevent calculations out of barstate.isconfirmedNota Keluaran
Improved extremums detectionNota Keluaran
One more fix for extremums detectionNota Keluaran
improved searching of a first extremumNota Keluaran
Support and Resistance Levels IndicatorThis indicator automatically identifies the most significant support and resistance levels based on multiple key criteria. It assists traders in spotting potential reversal zones and evaluating the strength of price boundaries.
[hr]
How It Works
The indicator analyzes price data and determines key levels using these parameters:
- Number of Candle Touches — Counts how many times regular candlestick bodies or wicks interact with the level.
- Number of Extremum Touches — Measures how often local highs and lows touch each level.
- Number of False Breakouts — Tracks situations where the price briefly crosses and then quickly returns above/below the level.
- Number of Breakouts — Calculates confirmed price breaks through the level.
The algorithm weighs each factor to select the most significant support and resistance levels for current market conditions.
[hr]
How to Interpret
- More touches and extremum contacts signal a stronger price level.
- A level with many false breakouts may be more reliable in predicting future reversals.
- Levels with multiple confirmed breakouts indicate a possible shift in trend or reduced level significance.
[hr]
Recommendations
- Use as part of a broader trading strategy, not as a stand-alone signal.
- Adjust sensitivity or weighting of parameters in the settings for your preferred trading style and timeframe.
- Test the indicator with historical data to get familiar with how significant levels are selected.
[hr]
Note: This script does not constitute financial advice. Always combine with other analysis methods and manage your risk.
Skrip dilindungi
Skrip ini diterbitkan sebagai sumber tertutup. Akan tetapi, anda boleh menggunakannya secara bebas dan tanpa apa-apa had – ketahui lebih di sini.
Penafian
Maklumat dan penerbitan adalah tidak bertujuan, dan tidak membentuk, nasihat atau cadangan kewangan, pelaburan, dagangan atau jenis lain yang diberikan atau disahkan oleh TradingView. Baca lebih dalam Terma Penggunaan.