PROTECTED SOURCE SCRIPT
Telah dikemas kini Weighted EMA Indicator
Weighted EMA Indicator is a technical analysis tool designed to assist traders in making informed investment decisions by analyzing price movements. This indicator utilizes Exponential Moving Averages (EMAs) calculated with specific weighting over a set period, aiming to provide a more accurate identification of market trends.
Purpose of Use:
The Weighted EMA Indicator helps traders observe how prices interact with certain moving averages. By using different EMA lengths (such as 13, 21, 34, 55, 89, and 144 periods), the indicator analyzes how prices behave around these moving averages. Users can calculate the "touch" counts for each EMA based on a defined lookback period (for example, 1000 bars). These touch counts indicate how frequently the price interacts with each EMA.
How to Use:
Adjusting Parameters: The indicator allows users to set the band width percentage, the number of lookback bars, and the lengths of various EMAs. These settings help traders adapt to different market conditions and strategies.
Observation: When displayed on a chart, the weighted EMA line provides insights into market trends. The weighted EMA ensures that EMAs with higher touch counts are weighted more heavily in the calculation, offering a more reliable analysis of price movements.
Decision Making: Traders can observe the intersections of the weighted EMA with price movements to make buy or sell decisions. For instance, if the price crosses above the weighted EMA, it could signal a buying opportunity, while crossing below may indicate a selling opportunity.
Conclusion:
The Weighted EMA Indicator is an effective tool for analyzing price movements and identifying market trends. With its flexible settings, users can create personalized trading strategies and make decisions that align with current market conditions. This enables traders to invest more consciously and strategically.
Nota Keluaran
Weighted EMA Indicator is a technical analysis tool designed to assist traders in making informed investment decisions by analyzing price movements. This indicator utilizes Exponential Moving Averages (EMAs) calculated with specific weighting over a set period, aiming to provide a more accurate identification of market trends.Purpose of Use:
The Weighted EMA Indicator helps traders observe how prices interact with certain moving averages. By using different EMA lengths (such as 13, 21, 34, 55, 89, and 144 periods), the indicator analyzes how prices behave around these moving averages. Users can calculate the "touch" counts for each EMA based on a defined lookback period (for example, 1000 bars). These touch counts indicate how frequently the price interacts with each EMA.
How to Use:
Adjusting Parameters: The indicator allows users to set the band width percentage, the number of lookback bars, and the lengths of various EMAs. These settings help traders adapt to different market conditions and strategies.
Observation: When displayed on a chart, the weighted EMA line provides insights into market trends. The weighted EMA ensures that EMAs with higher touch counts are weighted more heavily in the calculation, offering a more reliable analysis of price movements.
Decision Making: Traders can observe the intersections of the weighted EMA with price movements to make buy or sell decisions. For instance, if the price crosses above the weighted EMA, it could signal a buying opportunity, while crossing below may indicate a selling opportunity.
Conclusion:
The Weighted EMA Indicator is an effective tool for analyzing price movements and identifying market trends. With its flexible settings, users can create personalized trading strategies and make decisions that align with current market conditions. This enables traders to invest more consciously and strategically.
Nota Keluaran
Error fixed → The countTouches() function's issue of returning na values has been resolved.Safe return value → The function now always returns a numeric value, preventing na errors using nz().
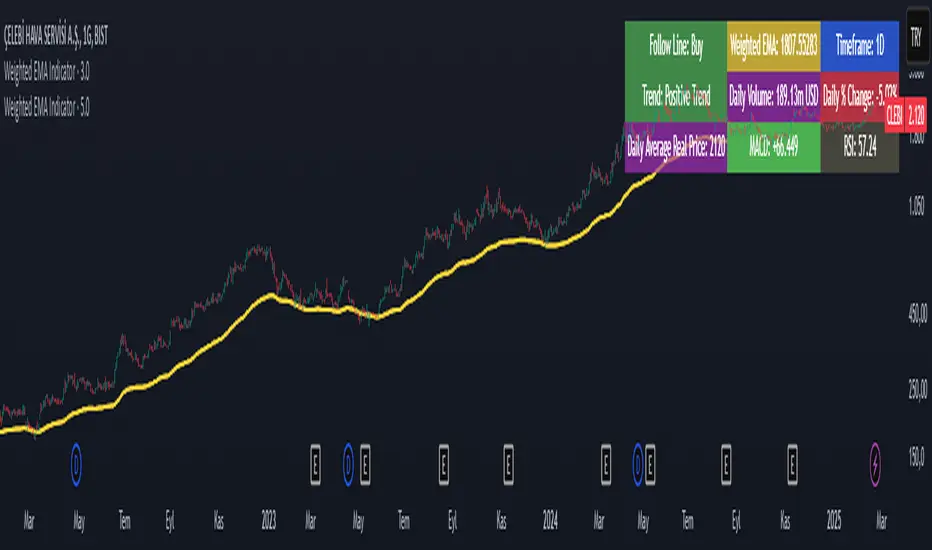
Price label added to the chart → A label has been added to display the real-time value of the yellow line (weighted EMA) on the chart.
Nota Keluaran
updateNota Keluaran
Trend Status: Translated "Pozitif Trend" and "Negatif Trend" to English.Color Changes: Displayed positive trend in green and negative trend in red.
Table Positioning: Added the option for the user to choose the position of the table in different corners.
Weighted EMA Text: Changed the background of the "Weighted EMA" text to yellow.
Table Adjustments: Updated the table displaying the trend status and Weighted EMA information, making the colors more prominent.
Nota Keluaran
updateNota Keluaran
updateNota Keluaran
UpdateNota Keluaran
Row Column Content Description
0 0 Follow Line: (Status) Displays "Buy" or "Sell" signals. If no signal, it shows "No Signal".
0 1 Trend: (Trend Status) "Positive Trend" if price is above Weighted EMA, "Negative Trend" if below.
1 0 Weighted EMA: (Value) The calculated Weighted EMA value. If multiple EMAs are active, their average is shown.
1 1 MACD: (Value / Signal) The MACD value and whether it gives a bullish or bearish signal.
1 2 RSI: (Value / Overbought-Oversold) The RSI value and whether it is in overbought (>70) or oversold (<30) zones.
2 0 Timeframe: (Current Timeframe) Displays the current trading timeframe (e.g., 1D, 1H, 5M).
2 1 Daily % Change: (Price Movement) Shows the percentage change in price compared to the previous day’s close. Green if positive, red if negative.
2 2 Volume (Daily): (Trading Volume) The daily trading volume, formatted as millions (‘m’) or thousands (‘k’), e.g., "1.25m USD" or "900k USD".
3 0 Daily Average Real Price: (Value) The average price of the asset for the day, considering price fluctuations.
Nota Keluaran
UpdateSkrip dilindungi
Skrip ini diterbitkan sebagai sumber tertutup. Akan tetapi, anda boleh menggunakannya secara bebas dan tanpa apa-apa had – ketahui lebih di sini.
Penafian
Maklumat dan penerbitan adalah tidak bertujuan, dan tidak membentuk, nasihat atau cadangan kewangan, pelaburan, dagangan atau jenis lain yang diberikan atau disahkan oleh TradingView. Baca lebih dalam Terma Penggunaan.
Skrip dilindungi
Skrip ini diterbitkan sebagai sumber tertutup. Akan tetapi, anda boleh menggunakannya secara bebas dan tanpa apa-apa had – ketahui lebih di sini.
Penafian
Maklumat dan penerbitan adalah tidak bertujuan, dan tidak membentuk, nasihat atau cadangan kewangan, pelaburan, dagangan atau jenis lain yang diberikan atau disahkan oleh TradingView. Baca lebih dalam Terma Penggunaan.