PROTECTED SOURCE SCRIPT
Telah dikemas kini SMA Oscillation Strength Index

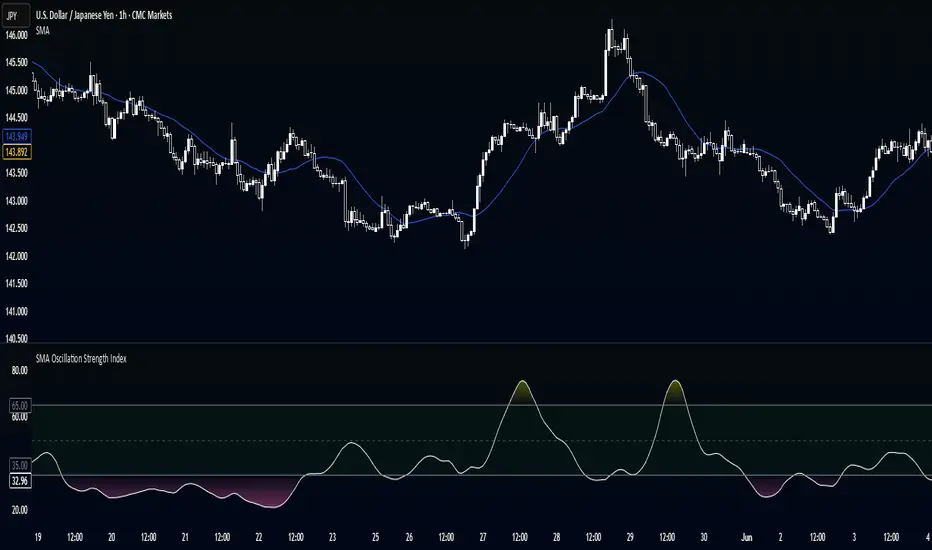
This indicator quantifies how strongly price oscillates around a simple moving average (SMA), normalized to a 0–100 scale for easier interpretation.
It calculates the standard deviation of the distance between price and its SMA over a lookback period, then normalizes that value by dividing it by the current ATR to account for volatility. This produces a raw "oscillation strength" signal.
The signal is then smoothed using an EMA and rescaled from its expected range (0–3) to a normalized 0–100 scale. The final output increases when price oscillates clearly above and below the SMA (e.g., in ranging conditions), and stays low when price hugs the SMA tightly (e.g., in low-volatility or noisy conditions).
Customizable upper and lower thresholds allow the user to mark different strength regimes, such as "ranging" vs "flat".
Nota Keluaran
Updated ChartSkrip dilindungi
Skrip ini diterbitkan sebagai sumber tertutup. Akan tetapi, anda boleh menggunakannya dengan percuma dan tanpa had – ketahui lebih lanjut di sini.
Penafian
Maklumat dan penerbitan adalah tidak dimaksudkan untuk menjadi, dan tidak membentuk, nasihat untuk kewangan, pelaburan, perdagangan dan jenis-jenis lain atau cadangan yang dibekalkan atau disahkan oleh TradingView. Baca dengan lebih lanjut di Terma Penggunaan.
Skrip dilindungi
Skrip ini diterbitkan sebagai sumber tertutup. Akan tetapi, anda boleh menggunakannya dengan percuma dan tanpa had – ketahui lebih lanjut di sini.
Penafian
Maklumat dan penerbitan adalah tidak dimaksudkan untuk menjadi, dan tidak membentuk, nasihat untuk kewangan, pelaburan, perdagangan dan jenis-jenis lain atau cadangan yang dibekalkan atau disahkan oleh TradingView. Baca dengan lebih lanjut di Terma Penggunaan.