PROTECTED SOURCE SCRIPT
Quantura - Supply & Demand Zone Detection
Introduction
“Quantura – Supply & Demand Zone Detection” is an advanced indicator designed to automatically detect and visualize institutional supply and demand zones, as well as breaker blocks, directly on the chart. The tool helps traders identify key areas of market imbalance and potential reversal or continuation zones, based on price structure, volume, and ATR dynamics.
Originality & Value
This indicator provides a unique and adaptive method of zone detection that goes beyond simple pivot or candle-based logic. It merges multiple layers of confirmation—volume sensitivity, ATR filters, and swing structure—while dynamically tracking how zones evolve as the market progresses. Unlike traditional supply and demand indicators, this script also detects and plots Breaker Zones when previous imbalances are violated, giving traders an extra layer of market context.
The key values of this tool include:
Functionality & Core Logic
The indicator continuously scans recent price data for swing highs/lows and combines them with optional volume and ATR conditions to validate potential zones.
Parameters & Customization
Core Calculations
Visualization & Display
Use Cases
Limitations & Recommendations
Markets & Timeframes
The “Quantura – Supply & Demand Zone Detection” indicator is suitable for all asset classes including cryptocurrencies, Forex, indices, commodities, and equities. It performs reliably across multiple timeframes, from intraday scalping to higher timeframe swing analysis.
Author & Access
Developed 100% by Quantura. Published as a protected source script indicator. Access is free.
Important
This description complies with TradingView’s Script Publishing and House Rules. It clearly explains the indicator’s originality, underlying logic, functionality, and intended use without unrealistic claims or performance guarantees.
“Quantura – Supply & Demand Zone Detection” is an advanced indicator designed to automatically detect and visualize institutional supply and demand zones, as well as breaker blocks, directly on the chart. The tool helps traders identify key areas of market imbalance and potential reversal or continuation zones, based on price structure, volume, and ATR dynamics.
Originality & Value
This indicator provides a unique and adaptive method of zone detection that goes beyond simple pivot or candle-based logic. It merges multiple layers of confirmation—volume sensitivity, ATR filters, and swing structure—while dynamically tracking how zones evolve as the market progresses. Unlike traditional supply and demand indicators, this script also detects and plots Breaker Zones when previous imbalances are violated, giving traders an extra layer of market context.
The key values of this tool include:
- Automated detection of high-probability supply and demand zones.
- Integration of both volume and ATR filters for precision and adaptability.
- Dynamic zone merging and updating based on price evolution.
- Identification of breaker blocks (invalidated zones) to visualize market structure shifts.
- Optional bullish and bearish trade signals when zones are retested.
- Clear, visually optimized plotting for efficient chart interpretation.
Functionality & Core Logic
The indicator continuously scans recent price data for swing highs/lows and combines them with optional volume and ATR conditions to validate potential zones.
- Demand Zones are formed when price action indicates accumulation or a strong bullish rejection from a low area.
- Supply Zones are created when distribution or strong bearish rejection occurs near local highs.
- Breaker Blocks appear when existing zones are invalidated by price, helping traders visualize potential market structure shifts.
- Bullish and bearish signals appear when price re-enters an active zone or breaks through a breaker block.
Parameters & Customization
- Demand Zones / Supply Zones: Enable or disable each individually.
- Breaker Zones: Activate breaker block detection for invalidated zones.
- Volume Filter: Optional filter to only confirm zones when volume exceeds its long-term average by a user-defined multiplier.
- ATR Filter: Optional filter for volatility confirmation, ensuring zones form under strong momentum conditions.
- Swing Length: Controls the number of bars used to detect structural pivots.
- Sensitivity Controls: Adjustable ATR and volume multipliers to fine-tune detection responsiveness.
- Signals: Toggle for on-chart bullish (▲) and bearish (▼) signal plotting when price interacts with zones.
- Color Customization: User-defined bullish and bearish colors for both standard and breaker zones.
Core Calculations
- Zones are detected using pivot highs and lows with a defined lookback and lookahead period.
- Additional filters apply if ATR and volume are enabled, requiring conditions like “ATR > average * multiplier” and “Volume > average * multiplier.”
- Detected zones are merged if overlapping, keeping the chart clean and logical.
- When price breaks through a zone, the original box is closed, and a new breaker zone is plotted automatically.
- Bullish and bearish markers appear when zones are retested from the opposite side.
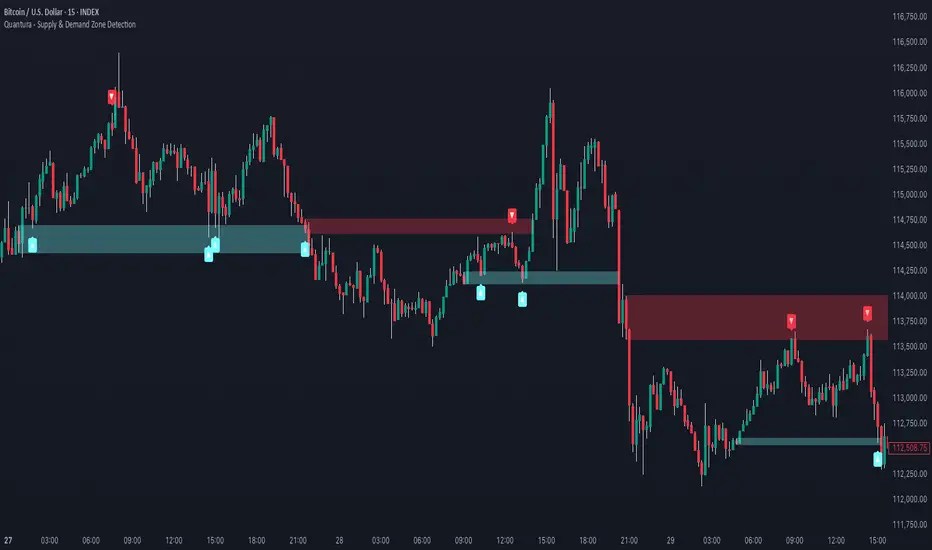
Visualization & Display
- Demand zones are shaded in semi-transparent bullish color (default: blue).
- Supply zones are shaded in semi-transparent bearish color (default: red).
- Breaker zones appear when previous imbalances are broken, helping to spot structural shifts.
- Optional arrows (▲ / ▼) indicate potential buy or sell reactions on zone interaction.
Use Cases
- Identify institutional areas of accumulation (demand) or distribution (supply).
- Detect potential breakout traps and market structure shifts using breaker zones.
- Combine with other tools such as volume profile, EMA, or liquidity indicators for deeper confirmation.
- Observe retests and reactions of zones to anticipate possible reversals or continuations.
- Apply multi-timeframe analysis to align higher timeframe zones with lower timeframe entries.
Limitations & Recommendations
- The indicator does not predict future price movement; it highlights structural imbalances only.
- Performance depends on chosen swing length and sensitivity — users should optimize parameters for each market.
- Works best in volatile markets where supply and demand imbalances are clearly expressed.
- Should be used as part of a broader trading framework, not as a standalone signal generator.
Markets & Timeframes
The “Quantura – Supply & Demand Zone Detection” indicator is suitable for all asset classes including cryptocurrencies, Forex, indices, commodities, and equities. It performs reliably across multiple timeframes, from intraday scalping to higher timeframe swing analysis.
Author & Access
Developed 100% by Quantura. Published as a protected source script indicator. Access is free.
Important
This description complies with TradingView’s Script Publishing and House Rules. It clearly explains the indicator’s originality, underlying logic, functionality, and intended use without unrealistic claims or performance guarantees.
Skrip dilindungi
Skrip ini diterbitkan sebagai sumber tertutup. Akan tetapi, anda boleh menggunakannya dengan percuma dan tanpa had – ketahui lebih lanjut di sini.
Get instant access at quantura.io/
Penafian
Maklumat dan penerbitan adalah tidak dimaksudkan untuk menjadi, dan tidak membentuk, nasihat untuk kewangan, pelaburan, perdagangan dan jenis-jenis lain atau cadangan yang dibekalkan atau disahkan oleh TradingView. Baca dengan lebih lanjut di Terma Penggunaan.