1-BTC

Risk Metrics: Crypto VersionRisk Metrics for Crypto.
Market can be set to BTCUSD, BTCEUR, BTCCHF, BTCGBP, BTC1!, BTC2!, SPX, and DTB3
Beta
Correlation
Standard Deviation
Variance
R-squared

BITCOIN Miners Revenue VS Price Correlation OscillatorUse 3D(3-day candle) as timeframe for best reading.
------
original template for Correlation indicator was created by obaranova. credit goes to her.

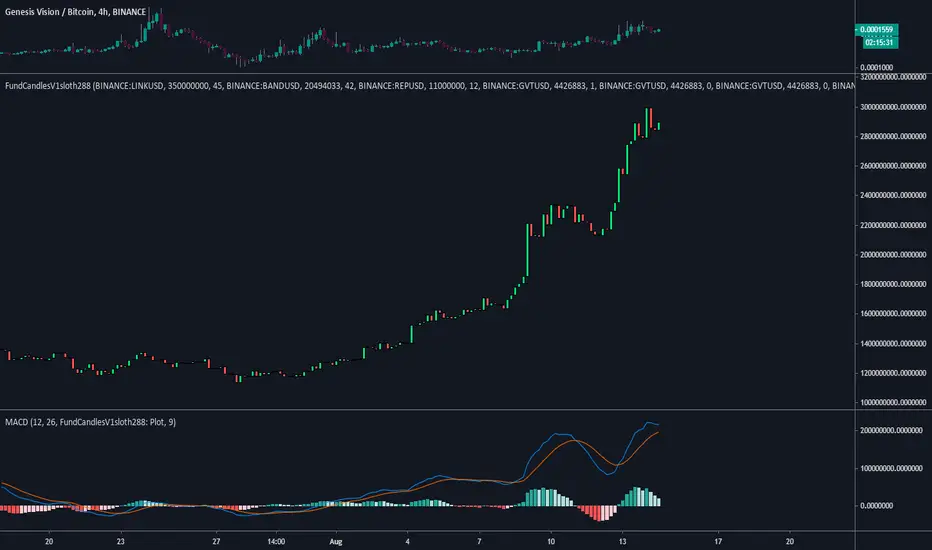
FundCandlesV1sloth288FundCandlesV1sloth288 is an indicator I decided to put together so I can track how funds are doing on $GVT Genesis Vision.
Using a standard MACD or RSI indicator you can change source to use the FundsCandles values to determine if its a good time to enter or exit different funds on the platform.
What you need to know...
Currently all securities need to pair the same, (USD / BTC ).
Security 01, 02, 03 etc etc to maximum of 10 need to be in "BINANCE:LINKUSD" format.
Manually need to input circulating supply from CMC to get the proper ratios for index.
Allocation is the % of the funds exposure to said security.
Inputting the values does not track previous reallocation's, the whole chart will be if the history of the fund was using up to date settings.
Values on the right is the Marketcap of the fund.
Standard settings is of Oracle Basket on the platform made by Somnium Funds as of Aug 13 2020.
Next update will be after GV includes traditional stocks onto the platform for managers to diversify their current allocations into them.
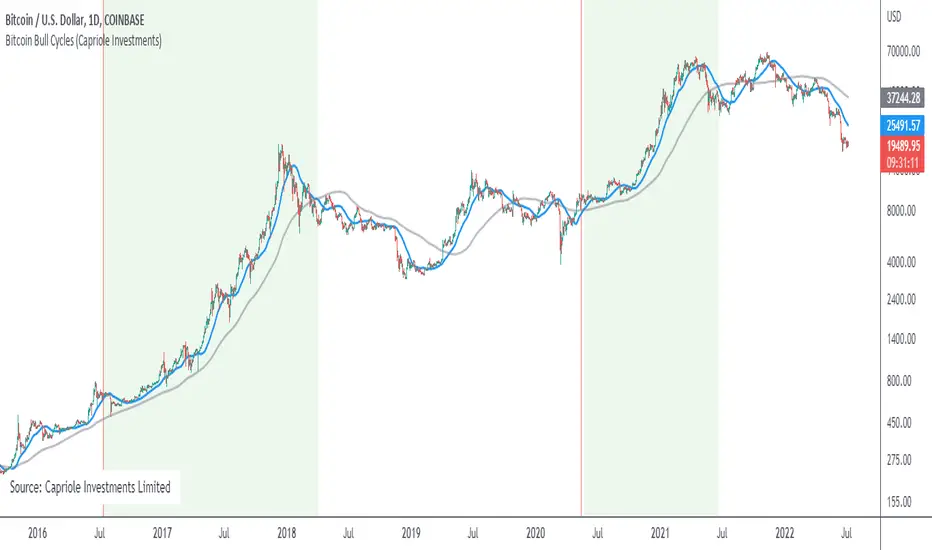
Bitcoin Bull CyclesA simple indicator that identifies the primary upswing of Bitcoin following each Halving, the "Bull Cycle".
A "Bull Cycle" is identified as the first period of positive momentum after each Halving date, defined as the 50 Daily Moving Average (DMA) being above the 200 DMA.
[2020 Updated]Bitcoin Logarithmic Growth CurvesCredit goes to the original writer of the script, Quantadelic, who generously allowed anyone to copy/edit. I adjusted the value of the bottom/top intercept and slope to better fit the March 2020 coronavirus dip.
Use Bitstamp BTCUSD for better reading.

TSI CCI Hull with profit$$$$ , Alert versionThis is a modified version of @SeaSide420 TSI CCI Hull with profits exit on long and short order with alert as well
original script :
the strategy script:
/// feel free to edit/improve and comment

Smooth Hash RibbonsSame as the popular hash ribbon indicator, but slightly more responsive and with a better smoothing kernel.

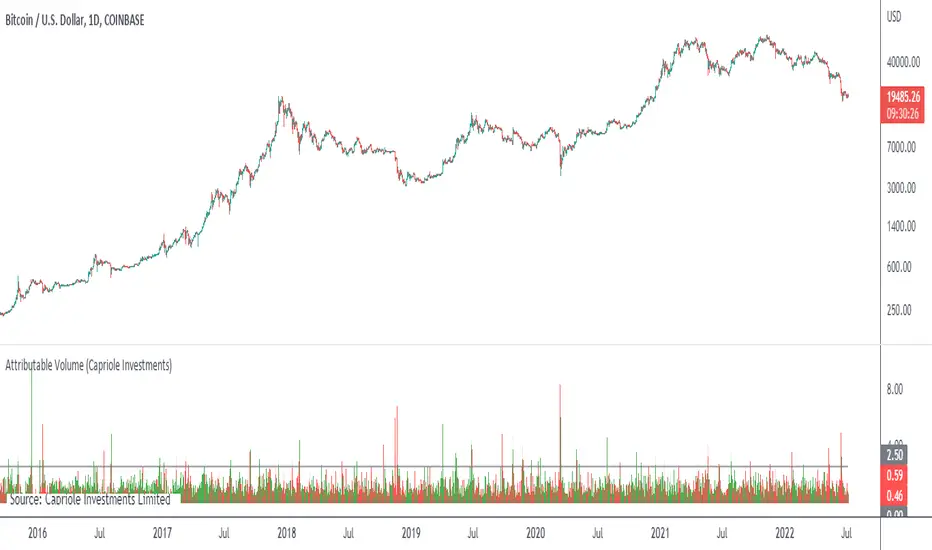
Attributable VolumeA volume indicator which calculates "Attributable Volume”, the portion of volume which contributed to the direction in which the candle moved.
Attributable Volume is calculated as: Total volume excluding the "counter wick" volume.
Where for a green (up) candle, the "counter wick" volume is the top wick volume.
In theory, Attributable Volume should better represent the effort of directional thrust of each candle.
By default, this indicator displays “Attributable RVOL”, but can be set to:
Attributable RVOL
RVOL
Attributable Volume
Volume
Note: RVOL = Relative Volume, the current volume divided by the Volume moving average. RVOL can be used to identify major moves, and potential starts/ends to trends.
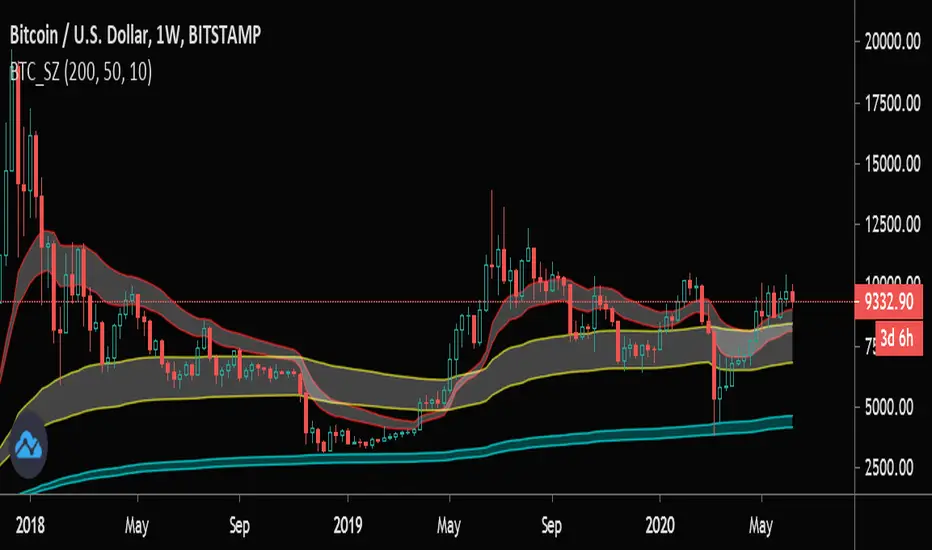
BTC SWING ZONESHigh Time Frame EVWMA Envelopes for BTC spot. Should only be used on Weekly time frame and higher.
BTFD and Chill!
Hello VWAP "Beta"This is my 1st indicator, and my attention is to plot the VWAP "Volume-weighted average price" using the SMA "Simple Moving Average" over time... IE over the last 50,100,200 bars and just the VWAP... All of them in just one line... I have made it when I have been using the BTC/US chart, but it should work for stocks/forex or any other chart that you want to use...
I am not completely sure about this indicator and I do want to add more to this, that is how come I am posting to the community to show what I have done and people can use it and if they are open to it give me feedback or tips to make it better...
Happy trading...

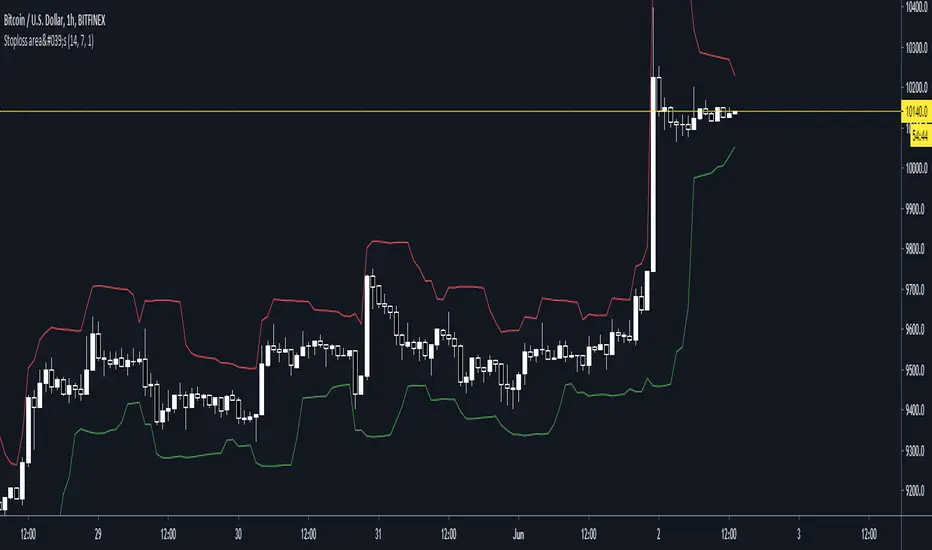
Stoploss indicatorGood for setting trailing stops and stoplosses when your taking a scalp etc, most recommended for manual trailing stops
Simple EMA trend indicatorSimple EMA trend indicator , pretty straightforward green equates to bullish and usually a retest/wick is often seen , same for the flipside viceversa


Bitcoin SpreadThis indicator display the current lowest and the highest value of btc on a set of exchanges for a define type of market.
Bitcoin Spread was originally made by @DayTradingItalia, i have bring his indicator to pine v4, add add some stuff to it:
5 Type of BTC Market : USDT Swap, USD and Futures (current/next contract)
Spread value


msoro daily DCATool to estimate PnL of your investment if you put in a fixed $ amount daily into btc for past year. It takes input as 365 days which can be changed as per need.

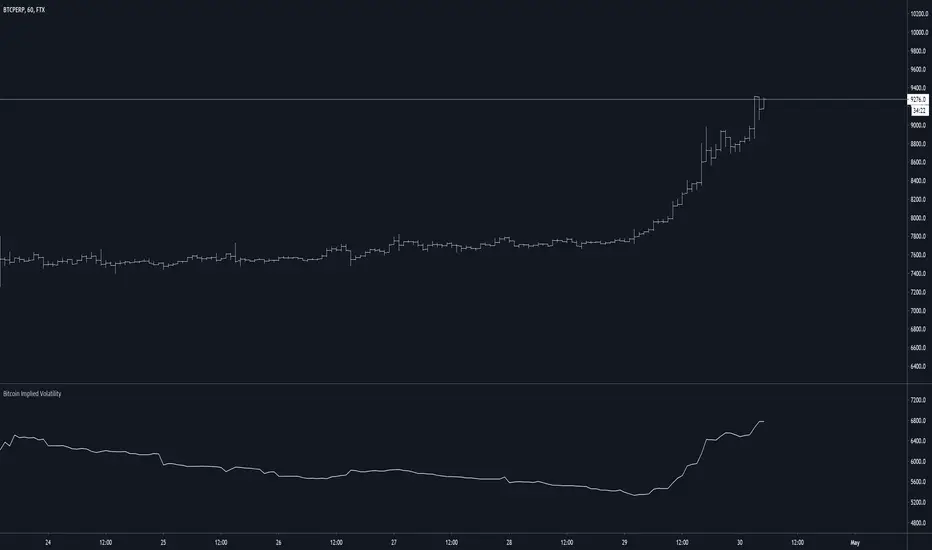
Bitcoin Implied VolatilityThis simple script collects data from FTX:BVOLUSD to plot BTC’s implied volatility as a standalone indicator instead of a chart.
Implied volatility is used to gauge future volatility and often used in options trading.
Crypto Market CorrelationThis script utilized some new functions in Pine Script, which compares the correlation between the current symbol to a basket of crypto indexes that are listed on the FTX exchange.
By tracking these indexes we can gauge the reaction across markets that have a different market cap. By that I mean we can have a better idea about where the money is flowing into a specific market.
This script uses data from FTX:BTCPERP, FTX:ALTPERP, FTX:MIDPERP, FTX:SHITPERP, FTX:EXCHPERP, FTX:DRGNPERP.
A value closer to 1 equals to more correlation, closer to 0 equals to less correlation.

eha MA CrossIn the study of time series, and specifically technical analysis of the stock market, a moving-average cross occurs when, the traces of plotting of two moving averages each based on different degrees of smoothing cross each other. Although it does not predict future direction but at least shows trends.
This indicator uses two moving averages, a slower moving average and a faster-moving average. The faster moving average is a short term moving average. A short term moving average is faster because it only considers prices over a short period of time and is thus more reactive to daily price changes.
On the other hand, a long term moving average is deemed slower as it encapsulates prices over a longer period and is more passive. However, it tends to smooth out price noises which are often reflected in short term moving averages.
There are a bunch of parameters that you can set on this indicator based on your needs.
Moving Averages Algorithm
You can choose between three types provided of Algorithms
Simple Moving Average
Exponential Moving Average
Weighted Moving Average
I will update this study with more educational materials in the near future so be informed by following the study and let me know what you think about it.
Please hit the like button if this study is useful for you.

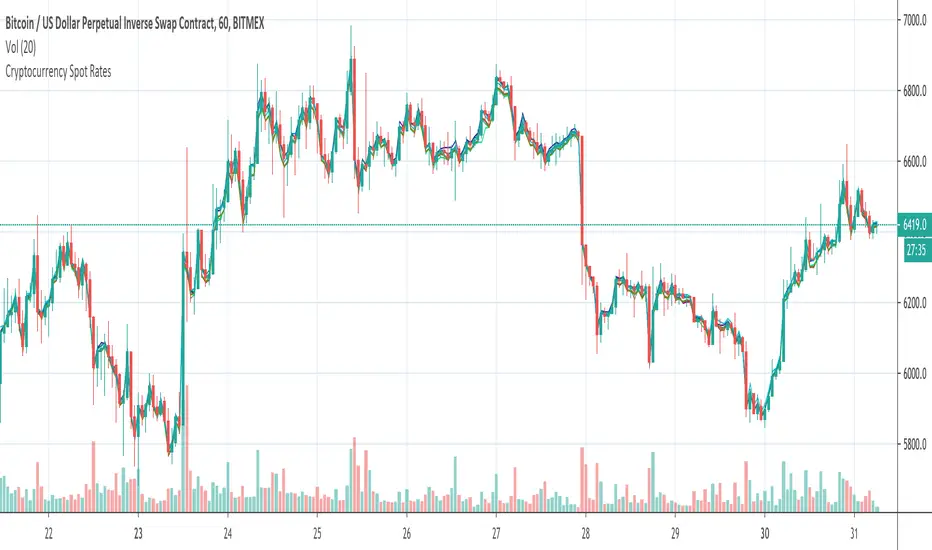
Cryptocurrency Spot RatesThis is an overlay indicator on the chart that will plot cryptocurrency spot prices of the following exchanges:
- Coinbase
- Poloniex
- OKCOIN
- Binance
- Huobi
- Bittrex
- HitBTC
- Kraken
- Bitfinex
Additionally it plots the price average of all those exchanges.
This overlay is intended to be used on charts with derivatives/futures such as BitMEX/Deribit/...
It works with all USD and Tether pairs on the main chart (for example BTCUSD, ETHUSD, BCHUSD,...)