Sector 50MA vs 200MA ComparisonThis TradingView indicator compares the 50-period Moving Average (50MA) and 200-period Moving Average (200MA) of a selected market sector or index, providing a visual and analytical tool to assess relative strength and trend direction. Here's a detailed breakdown of its functionality:
Purpose: The indicator plots the 50MA and 200MA of a chosen sector or index on a separate panel, highlighting their relationship to identify bullish (50MA > 200MA) or bearish (50MA < 200MA) trends. It also includes a histogram and threshold lines to gauge momentum and key levels.
Inputs:
Resolution: Allows users to select the timeframe for calculations (Daily, Weekly, or Monthly; default is Daily).
Sector Selection: Users can choose from a list of sectors or indices, including Tech, Financials, Consumer Discretionary, Utilities, Energy, Communication Services, Materials, Industrials, Health Care, Consumer Staples, Real Estate, S&P 500 Value, S&P 500 Growth, S&P 500, NASDAQ, Russell 2000, and S&P SmallCap 600. Each sector maps to specific ticker pairs for 50MA and 200MA data.
Data Retrieval:
The indicator fetches closing prices for the 50MA and 200MA of the selected sector using the request.security function, based on the chosen timeframe and ticker pairs.
Visual Elements:
Main Chart:
Plots the 50MA (blue line) and 200MA (red line) for the selected sector.
Fills the area between the 50MA and 200MA with green (when 50MA > 200MA, indicating bullishness) or red (when 50MA < 200MA, indicating bearishness).
Threshold Lines:
Horizontal lines at 0 (zero line), 20 (lower threshold), 50 (center), 80 (upper threshold), and 100 (upper limit) provide reference points for the 50MA's position.
Fills between 0-20 (green) and 80-100 (red) highlight key zones for potential overbought or oversold conditions.
Sector Information Table:
A table in the top-right corner displays the selected sector and its corresponding 50MA and 200MA ticker symbols for clarity.
Alerts:
Generates alert conditions for:
Bullish Crossover: When the 50MA crosses above the 200MA (indicating potential upward momentum).
Bearish Crossover: When the 50MA crosses below the 200MA (indicating potential downward momentum).
Use Case:
Traders can use this indicator to monitor the relative strength of a sector's short-term trend (50MA) against its long-term trend (200MA).
The visual fill between the moving averages and the threshold lines helps identify trend direction, momentum, and potential reversal points.
The sector selection feature allows for comparative analysis across different market segments, aiding in sector rotation strategies or market trend analysis.
This indicator is ideal for traders seeking to analyze sector performance, identify trend shifts, and make informed decisions based on moving average crossovers and momentum thresholds.
200dma

200DMA last DOM - ajhImplements and backtests a simple 200 day moving average trend following rules based on last day of month to limits trades to 12 per year.
From the book : 5 BEST Moving Average Strategies (That beat buy and hold) by Steve Burns and Holly Burns
Click on the cog to set the input date range eg; 2000-01-01 to 2016-12-31
The book back tested SP500 returns from 2000-2016 317% using this method vs 125% buy and hold only with less drawdown.
Simple 200 day moving average test and trading on last day of month.
(you may find it trades on next available day close to end of month as not all dates can be traded weekends etc..)
Rules are ;
1. if last day of month and stock over 200 day moving average, then go long 100%
2. if last day of month and stock under 200 day moving average, then close long 100% and goto cash.
Aims to miss market declines and keep you long for upside.
Note: Have found doesn't work well in choppy markets moving sideways like the FTSE100 for same period 2000-2016 and causes losses. Also for many stocks.

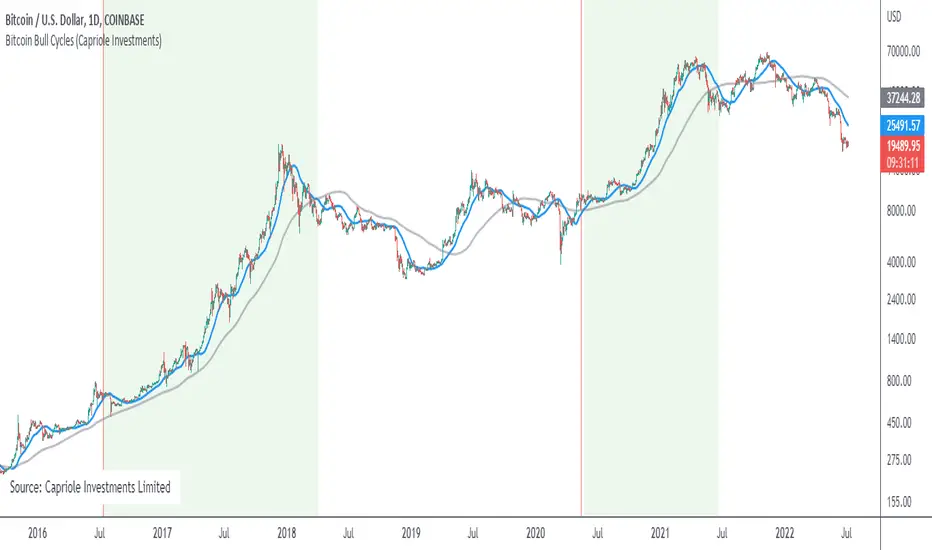
Bitcoin Bull CyclesA simple indicator that identifies the primary upswing of Bitcoin following each Halving, the "Bull Cycle".
A "Bull Cycle" is identified as the first period of positive momentum after each Halving date, defined as the 50 Daily Moving Average (DMA) being above the 200 DMA.