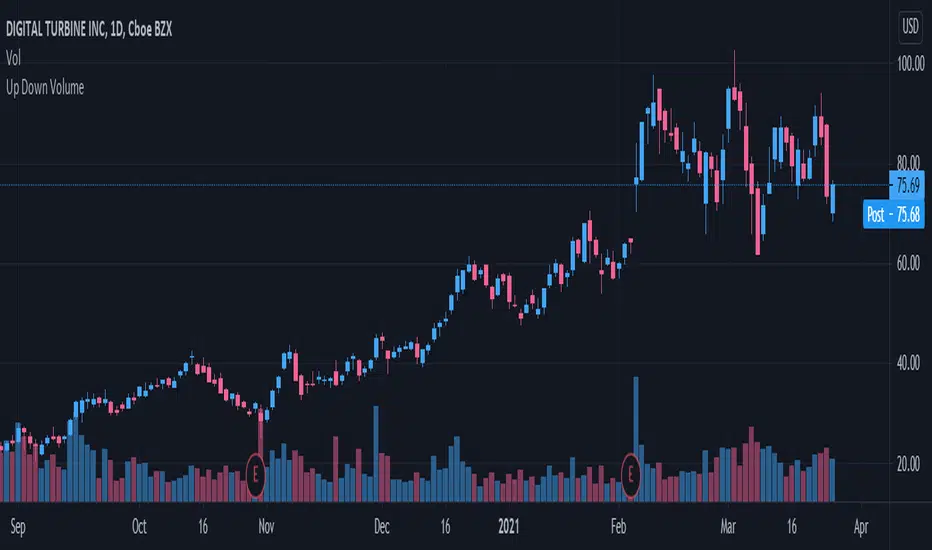
Up/Down Volume RatioUp/Down Volume Ratio is calculated by summing volume on days when it closes up and divide that total by the volume on days when the stock closed down.
High volume up days are typically a sign of accumulation(buying) by big players, while down days are signs of distribution(selling) by big market players. The Up Down volume ratio takes this assumption and turns it into a tangible number that's easier for the trader to understand. My formula is calculated using the past 50 periods, be warned it will not display a value for stocks with under 50 periods of trading history. This indicator is great for identify accumulation of growth stocks early on in their moves, most of the time you would like a growth stocks U/D value to be above 2, showing institutional sponsorship of a stock.
Up/Down Volume value interpretation:
U/D < 1 -> Bearish outlook, as sellers are in control
U/D = 1 -> Sellers and Buyers are equal
U/D > 1 -> Bullish outlook, as buyers are in control
U/D > 2 -> Bullish outlook, significant accumulation underway by market makers
U/D >= 3 -> MONSTER STOCK ALERT, market makers can not get enough of this stock and are ravenous to buy more
U/D values greater than 2 are rare and typically do not last very long, and U/D >= 3 are extremely rare one example I kind find of a stock's U/D peaking above 3 was Google back in 2005.
MAKE SURE TO HIT THE SETTINGS WHEEL AND CHECK THE BOX NEXT TO PLOT IN ORDER TO GET RID OF THE PLOTTED LINE.
Accumulation-distribution
Volume Buzz 2.0Volume Buzz/Volume Run Rate as seen on TC2000 and MarketSmith respectively.
Basically, the volume buzz tells you what percentage over average(100 time period moving average) the volume traded was. You can use this indicator to more readily identify above-average trading volume and accumulation days on charts. The percentage will show up in the top left corner, make sure to click the settings button and uncheck the second box(left of plot) in order to get rid of the chart line.
Pictured above, a chart with the volume on the bottom along with the 50-day moving average applied to volume. As you can see in the top left it will tell you the "volume buzz" of that day, telling you what days were on above-average volume and how above-average those days were.

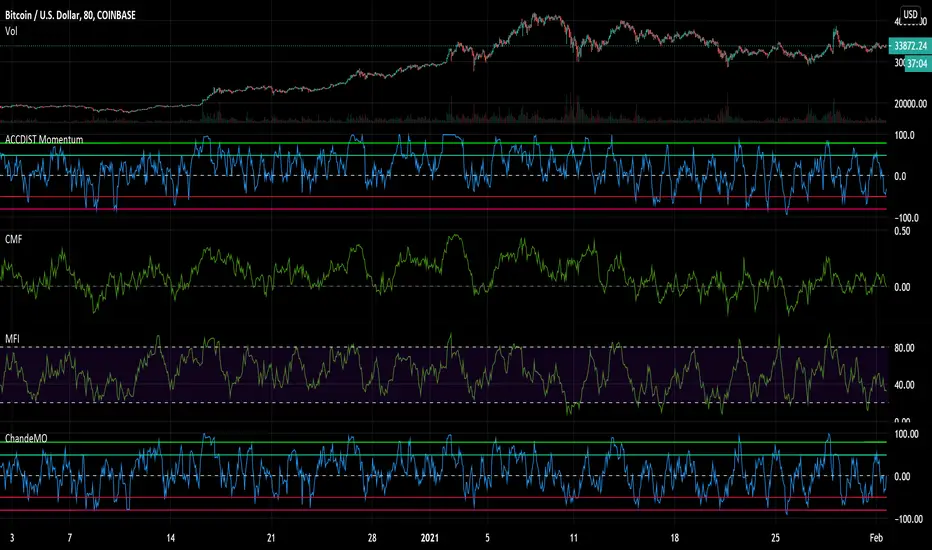
Accumulation and Distribution MomentumThis applies Chande Momentum to Accumulation and Distribution index as a means to changes.
Experimental oscillator.
Compare it to both Money Flows, Acc/Dis and Chande and you notice it has elements of all of them. Could potentially replace other volume based momentum indicators in your strategy.
It is a little more volatile, reaching from side to side, while having a tendency to lean towards the side that gets the most action over a longer period of time.
It also tends to reach and hang in oversold regions BEFORE a pump - something I noticed.
Could be used as an early warning sign as well as for overall trend analysis.
A/D + 21/200EMASimple Accumulation & Distribution indicator with the 21 and 200EMA plotted on it. Might be a useful tool in your arsenal.

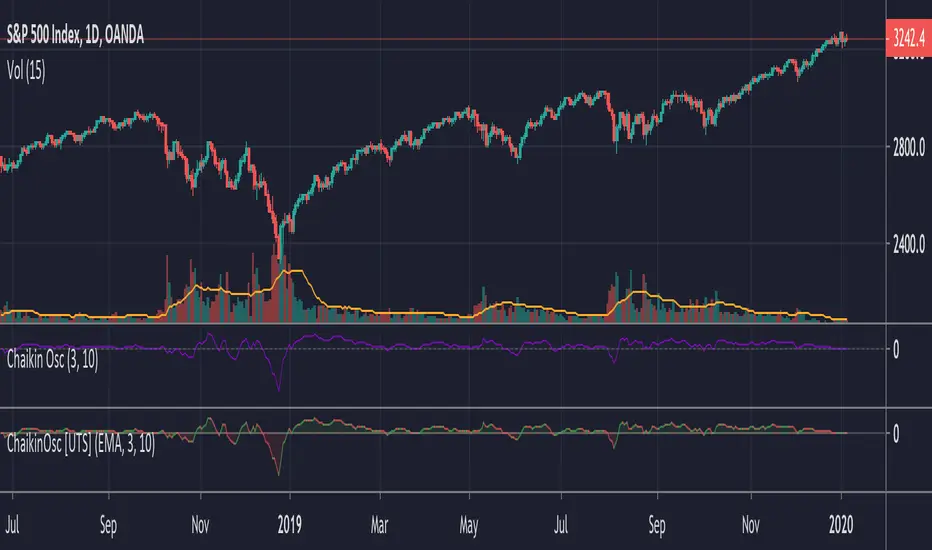
Chaikin Oscillator (ADL Oscillator) [UTS]The Chaikin Oscillator is basically an oscillator version of the Accumulation / Distribution Index, also known as ADL Indicator.
General Usage
The indicator runs both above and below zero, made to denote whether an asset is in a bullish (above zero) or bearish (below zero) trend.
It can be used to confirm trends, as well as spot possible trading signals due to divergences.
A benefit of the oscillator version is that it can produce LONG or SHORT signals on zero line cross.
Moving Averages
4 different Moving Averages are available:
EMA (Exponential Moving Average)
SMA (Simple Moving Average)
VWMA (Volume Weighted Moving Average)
WMA (Weighted Moving Average)
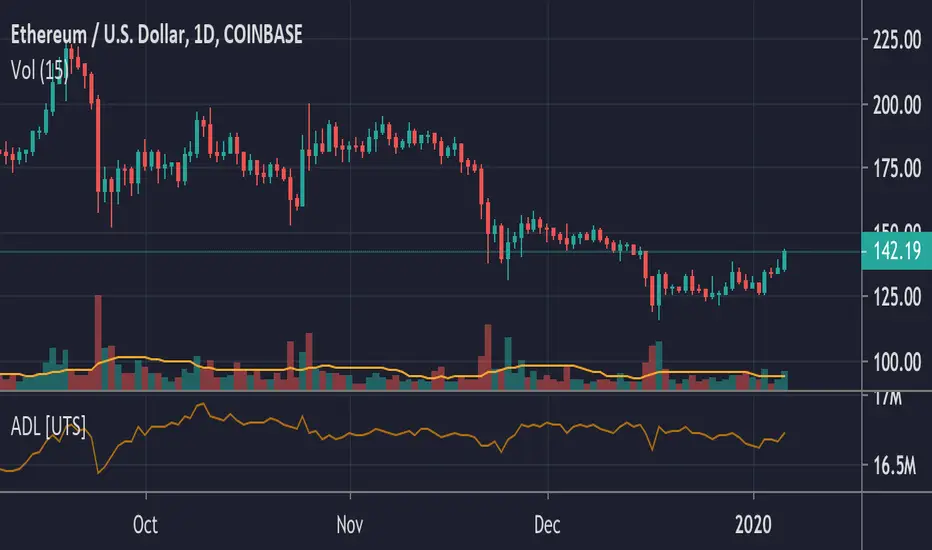
ADL - Accumulation Distribution Line [UTS]an underlying asset.
It is determined by the changes in price and volume. The volume acts as a weighting coefficient at the change of price — the higher the coefficient (the volume) is the greater the contribution of the price change (for this period of time) will be in the value of the indicator. The indicator is also known as Accumulation / Distribution Index.
Common known variants of this type of indicator are the On Balance Volume, Chaikin Oscillator or Chaikin Money Flow.
Based on www.metatrader5.com
Volume Extension [DepthHouse]DepthHouse Volume Extension uses average calculations to determine the dynamic range which the volume travels through. Any spike above the line represents an over extension in average volume.
The colored bars are then calculated in a similar way, which measures a combination of both price and volume action to determine bull & bear exhaustion levels, and possible entry/exit points for big players.
This indicator is 100% free , so if you benefit from using it, please consider supporting me by checking out the several other indicators available on my page :)

Ichimoku A/D Breakoutthis is basically a clone of the super a/d indicator but we're using a standard ichimoku as the source for the trend instead of the supertrend indicator


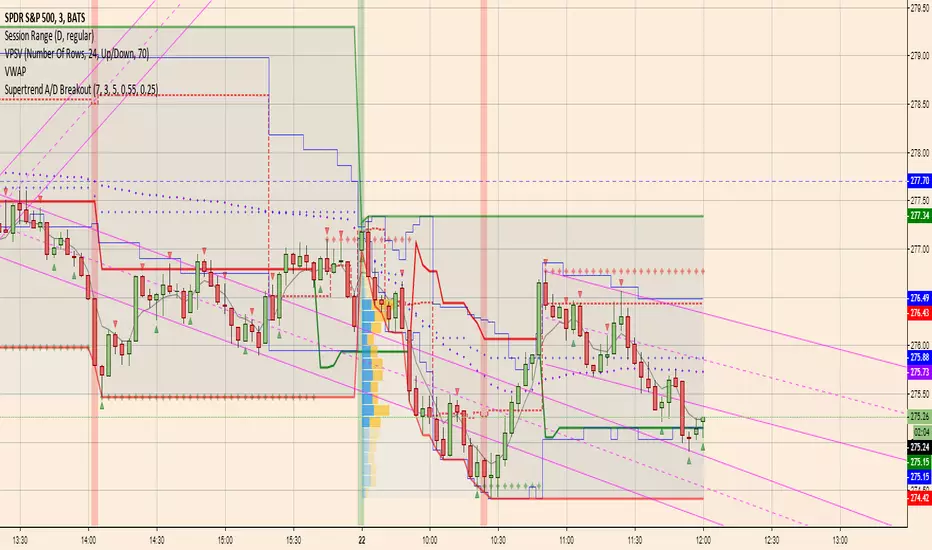
Supertrend A/D BreakoutModified Hoffman A/D:
1. uses standard supertrend to determine up/down direction (previous version used ema crossover)
2. uses improved A/D candlestick patterns
I'm optimistic about this one
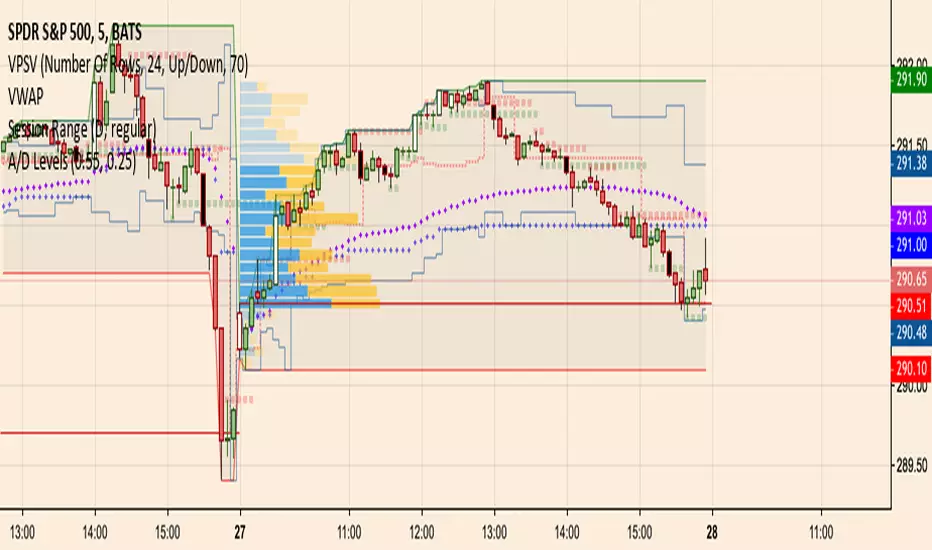
A/D Levelsuses reversal candles to determine accumulation and distribution candles
remembers the last reversal candle and draws a support or resistance line at the reversal level
does a barcolor if the price breaks support/resistance
similar to the hoffman a/d breakout indicator but there is no trend detection components
Hoffman A/D BreakoutStudy based on Rob Hoffman's Accumulation/Distribution Breakout strategy.
- Green circle on the top wick indicates a "Distribution" wick
- Red circle on the bottom wick indicates an "Accumulation" wick
- A distribution wick in an uptrend gets marked as a Key Resistance. This is marked with green crosses
- An Accumulation wick in a downtrend gets marked as a Key Support. This is marked with red crosses
- Breaking above the Key Resistance indicates a buy entry. This is marked by a green background.
- Breaking below the Key Support indicates a sell entry. This is marked by a red background


