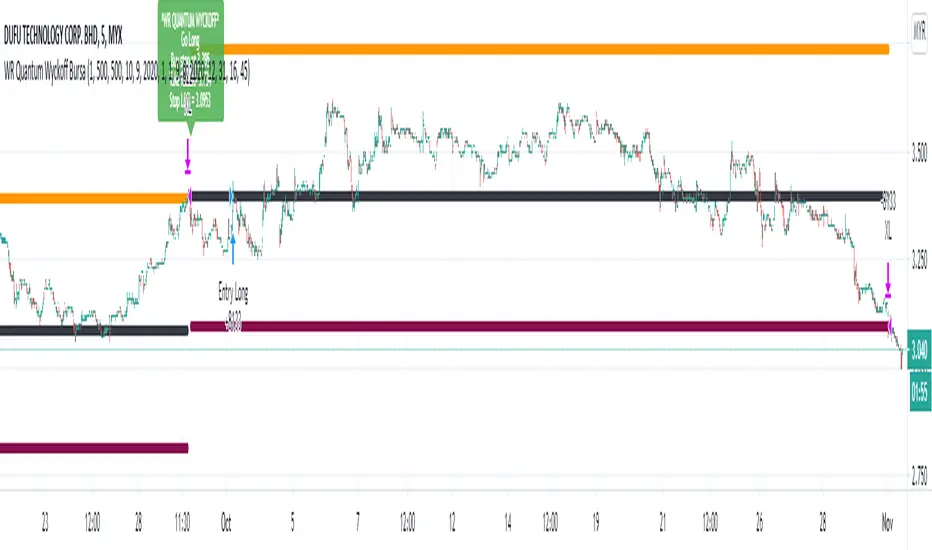
WR Quantum Wyckoff Bursa BacktestBURSA Malaysia trading robot alert is built based on WR Quantum Wyckoff Technique strategy.
The back test strategy is suitable to use in BURSA Saham.
The script will identify accumulation candle (box) at specific timeframe and will advice entry value and calculate advice take profit and stop loss based on % settable in the preset.
Once entry is confirm, script will popup one label with detail of Long Entry Condition.
This is an example of Indicator for Long Entry Condition:
ibb.co
This is setting for user to adjust to get best result for BURSA Counter:
ibb.co
User is given flexibility to adjust :
1. Date and Time Range for back test
2. Intraday or Swing strategy (Intraday - Intraday Box is selected, Swing - Intraday Box is not selected)
3. Take Profit % setting
4. Stop Loss % setting
Disclaimer:
This is a stock trading strategy that involves high risk of equity loss, You agree to use this script at your own risk.
If you have any suggestions, comments or interested to use this script, kindly PM us to obtain an access.
Accumulation
WR Quantum Wyckoff Robo BursaBURSA Malaysia trading robot alert is built based on WR Quantum Wyckoff Technique strategy.
The alert is suitable to use in BURSA Saham.
The script will identify accumulation candle (box) at specific timeframe and will advice entry value and calculate advice take profit and stop loss based on % settable in the preset.
Once entry is confirm, script will popup one label with detail of Long Entry Condition or Short Entry Condition.
This is an example of Long Entry Condition :
Disclaimer:
This is a stock trading strategy that involves high risk of equity loss, You agree to use this script at your own risk.
If you have any suggestions, comments or interested to use this script, kindly PM us to obtain an access.

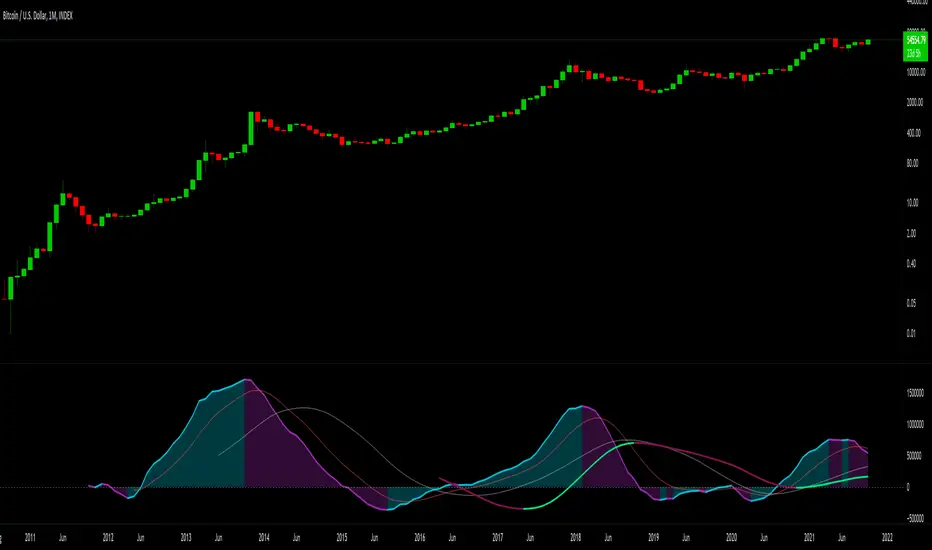
Price Divergence AccumulatePrice divergence is a good indicator to detect a trend change.
But only check the divergence value is not enough, the time range of how long the trend continues also needs to be measured.
This indicator accumulated Price Divergence until it turns from plus to minus or minus to plus.
From this Accumulated Price Divergence
1. The upper-level (long term) trend should be supported by the lower-level (short term) trend.
if the peaks of the lower-level trend become lower and lower, it is indicating the upper-level trend might get an adjustment.
2. At the beginning of the upper-level trend
The 1st lower-level trend peak might exceed the upper-level trend. But often we see it will be corrected and 2nd lower-level trend will be underneath the upper-level trend.

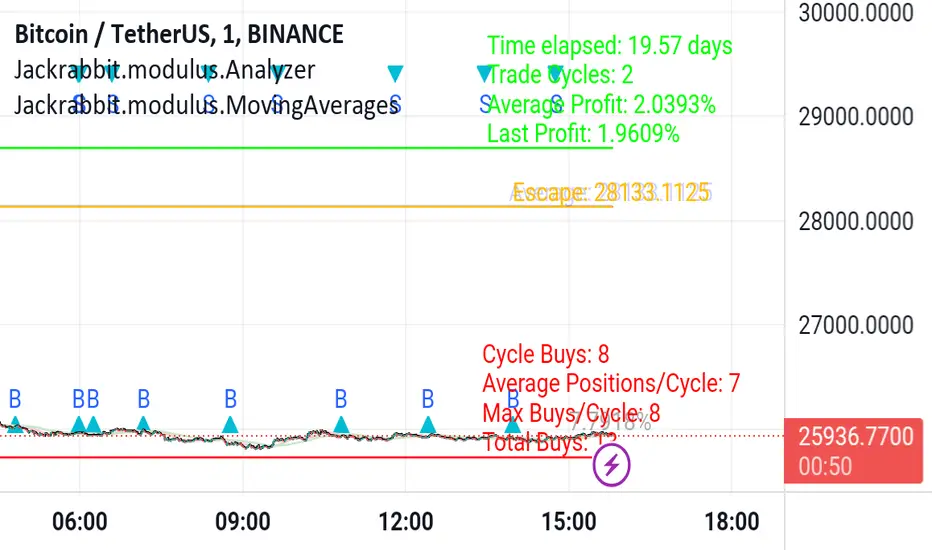
Jackrabbit.modulus.AnalyzerThis is the module Analyzer for the Jackrabbit suite and modulus framework.
As the modulus framework has grown both in size and complexity, it has become ever increasingly difficult to evaluate the profitability a very complex multi-layered modules combined.
The Jackrabbit Analyzer module allows you to do just that. Connect this module to the end of your IoI chain and it will tell you the profitability of your current combination, using TradingView's strategy backtesting capabilities.
With this module connected to your IoI chain, you can literally watch in real time as the analyzer evaluates your current settings and updates each time you make a change in those settings, giving you a better and more realistic approach to what is possible with your current strategy.
While this module is not a substitute for paper trading, it significantly increases the construction and analysis of a multi-layered trading paradigm that can then be taken to a paper trader with a high level of confidence of success.
Only the signal line is displayed.
The Jackrabbit modulus framework is a plug in play paradigm built to operate through TradingView's indicator on indicatior (IoI) functionality. As such, this script receives a signal line from the previous script in the IoI chain, and evaluates the buy/sell signals appropriate to the current analysis.
This script is by invitation only. To learn more about accessing this script, please see my signature or send me a PM. Thank you.
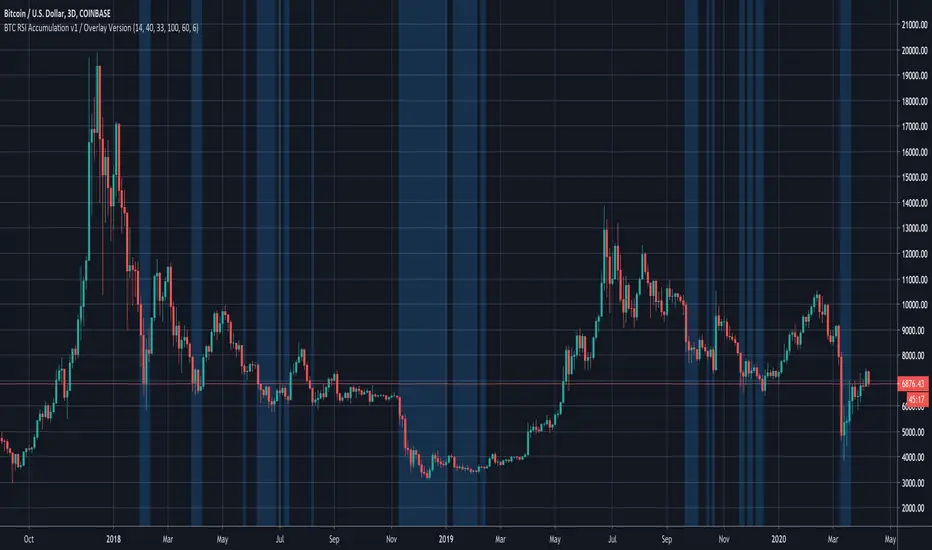
BTC RSI Accumulation Indicator for 3-Day ChartSimple indicator for highlighting typical Bitcoin accumulation RSI levels on a 3-day chart.

BTC RSI Accumulation Indicator for 3-Day Chart - Overlay VersionSimple indicator for highlighting typical Bitcoin accumulation RSI levels on a 3-day chart.
A/D + 21/200EMASimple Accumulation & Distribution indicator with the 21 and 200EMA plotted on it. Might be a useful tool in your arsenal.

Volume AccumulationA simple tool that accumulates the trading volume of an instrument for a specified period of time.
Available modes:
Minutely
Hourly
Session
Daily
Monthly
Quarterly
Yearly

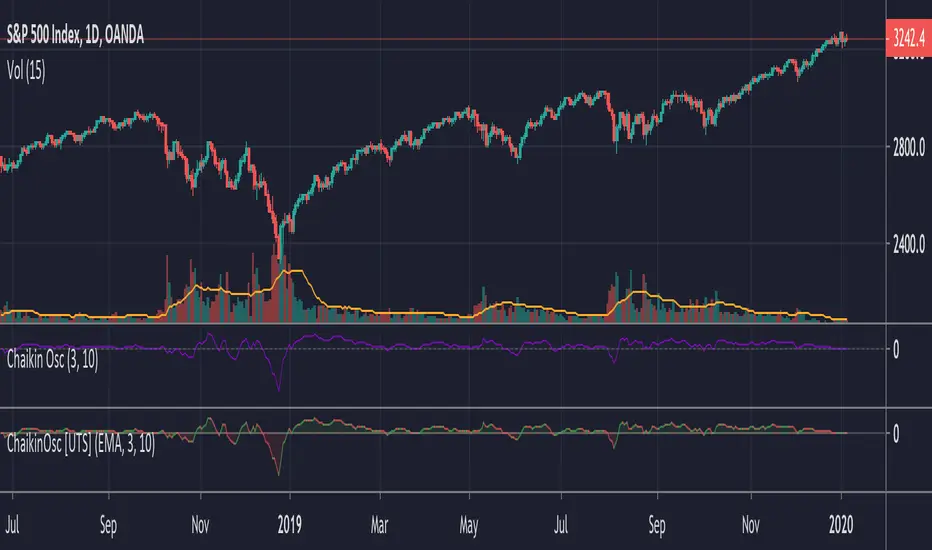
Chaikin Oscillator (ADL Oscillator) [UTS]The Chaikin Oscillator is basically an oscillator version of the Accumulation / Distribution Index, also known as ADL Indicator.
General Usage
The indicator runs both above and below zero, made to denote whether an asset is in a bullish (above zero) or bearish (below zero) trend.
It can be used to confirm trends, as well as spot possible trading signals due to divergences.
A benefit of the oscillator version is that it can produce LONG or SHORT signals on zero line cross.
Moving Averages
4 different Moving Averages are available:
EMA (Exponential Moving Average)
SMA (Simple Moving Average)
VWMA (Volume Weighted Moving Average)
WMA (Weighted Moving Average)
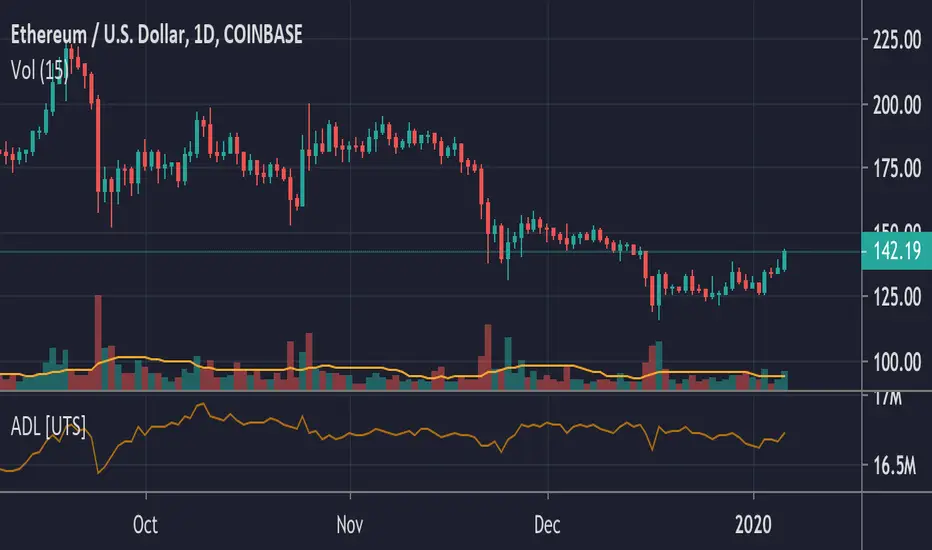
ADL - Accumulation Distribution Line [UTS]an underlying asset.
It is determined by the changes in price and volume. The volume acts as a weighting coefficient at the change of price — the higher the coefficient (the volume) is the greater the contribution of the price change (for this period of time) will be in the value of the indicator. The indicator is also known as Accumulation / Distribution Index.
Common known variants of this type of indicator are the On Balance Volume, Chaikin Oscillator or Chaikin Money Flow.
Based on www.metatrader5.com
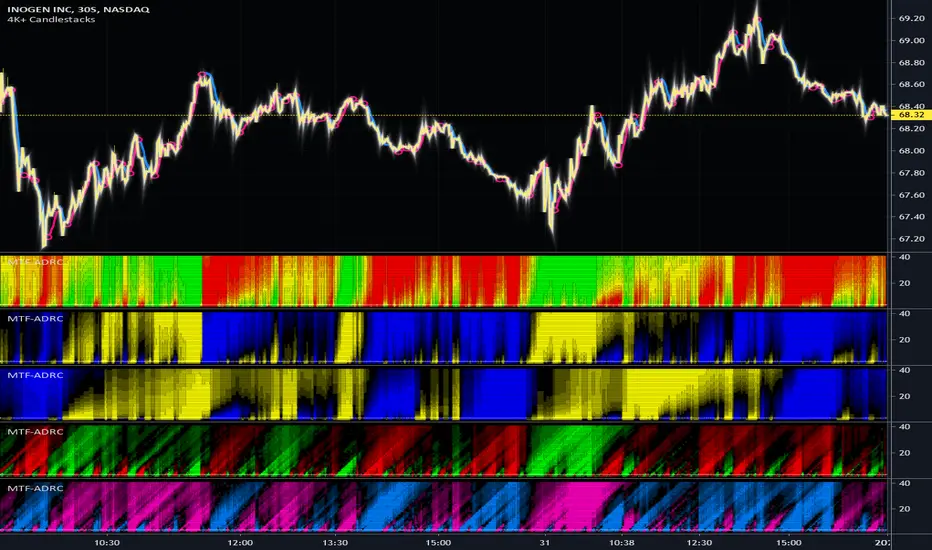
MTF Accumulation/Distribution RasterChart (Spectrogram/HeatMap)As my first published indicator for year 2020, I present my revolutionary "MTF Accumulation/Distribution RasterChart" employing PSv4.0. This is probably a world's first all-in-one multi-timeframe, multi-algorithm heatmap indicator with multiple color schemes. I decided to release this multicator now, because it has been a year long journey for me to develop spectrogram technology with abilities John Ehlers didn't include with his original heatmaps. I would like to personally thank Dr. John Ehlers for inspiring me to ponder into the realm of heatmap technology and all it has to offer. Thank you! You're a divine inspiration to the algorithmic trading community and forever shall be.
Each of the algorithms use "volume" and "price" data in their calculations to provide a unique spectrogram for either algorithm chosen, hence the accumulation/distribution attributed to the title of this indicator. The MTF capabilities include seconds, minutes, and days. If the time frame settings are shorter in time than the current sampling interval, a warning will be appropriately displayed. Also, when volume data is not applicable to an asset, the indicator will become completely red. I included so many color scheming techniques I couldn't demonstrate all of them above. This indicator has what I would term as "predator" vision. For those of you who have seen these movies, you will understand what I have built.
The use of this indicator is just like any of my other RasterCharts or heatmap indicators found on the internet, except it has much more versatility. This indicator has so many uses, I really haven't discovered all of it's characteristics yet. Anyhow, this is one of my most beautiful indicators I have created so far, but I feel there is still more room for enhancements with a possibility of more sibling algorithms to incorporate later. Lastly, I couldn't have done this without the computing power/wizardry provided by ALL Tradingview staff. They deserve a HUGE and proper, THANK YOU!!! Happy New Year 2020 everyone...
Features List Includes:
MTF controls for seconds, minutes, and days
Multiple volume weighted algorithms to choose from
Gain control for algorithm #1
Adjustable horizontal rule to differentiate between more reactive aspects of turning point fluctuations in the lower portion of the chart (visible above)
Adjustable heatmap brightness control
Visual color scheme techniques (a few of many are displayed above)
Color inversion control
"NO VOLUME" detection (indicator becomes red)
This is not a freely available indicator, FYI. To witness my Pine poetry in action, properly negotiated requests for unlimited access, per indicator, may ONLY be obtained by direct contact with me using TV's "Private Chats" or by "Message" hidden in my member name above. The comments section below is solely just for commenting and other remarks, ideas, compliments, etc... regarding only this indicator, not others. When available time provides itself, I will consider your inquiries, thoughts, and concepts presented below in the comments section, should you have any questions or comments regarding this indicator. When my indicators achieve more prevalent use by TV members, I may implement more ideas when they present themselves as worthy additions. As always, "Like" it if you simply just like it with a proper thumbs up, and also return to my scripts list occasionally for additional postings. Have a profitable future everyone!
Screener - Multi Timeframe [WYCKOFF ARSENAL]Screener - Multi Timeframe WYCKOFF ARSENAL
The general idea of The Wyckoff Method is that the trader can see the market as well-structured periods of Accumulation , Markup , Distribution and Markdown .
The price of an asset depends on its supply and demand .
There is more than one stock available for trading, and there is more than just Bitcoin on the Cryptocurrency market.
This means that one may choose to trade more than one asset and this perspective opens up a world of opportunities in which Supply and Demand are the masters.
For example, you have invested some money in a cryptocurrency, and you wait for it to Markup already.
But it is still in a long period of accumulation - it doesn't move much.
You should leave it and find another crypto that is moving.
To aid in the discovery of such opportunities, a Market Screener is available.
Method used: The Wyckoff Method of course.
The indicators used:
• Optimism Pessimism
• Force
• Technometer
• Momentum
The Wyckoff Arsenal Indicators can be used individually, and they are very useful when trading a single pair.
But the Market Screener can scan for opportunities in a wide range of pairs, or same asset but different trading platforms.
The indicators are based on volume, so the symbols must have volume data for the Screener to work.
Multiple indicator instances can be used to track a specific asset, like Bitcoin.
This way, all Bitcoin data available on TradingView could be used instead of data coming from a single trading platform.
Alerts: Overbought/Oversold conditions, Bollinger Bands crossings, Divergence detection.

AOOAOO is just working with volume so it's perfect for cryptocurrency and refers if the people are buying or selling.
Long ==> background is green
short ==> background is red

Hashem Accumulation/Distribution (V2)Hashem Accumulation/Distribution. Accumulative Net Delta.
Accumulation/Distribution Line with the Histogram of it. Basically shows the buyers and sellers on a move and trend.
Can analyze it to verify if the volume in a trend is confirming it or not.
Added markers when it cross the 0 Line in a Distribution. (after Accumulation) and Vice Versa.
Can be used for the Histogram Divergences and the A/D Line Slope logic for identifying a trend that is supported by the Volume.
PriceDivergence (ps4)This script implements price divergence module using signals from several factors like:
RSI, RSI Stochastic, MACD, Volume MA, Accumulation/Distribution, Fisher Transform and CCI


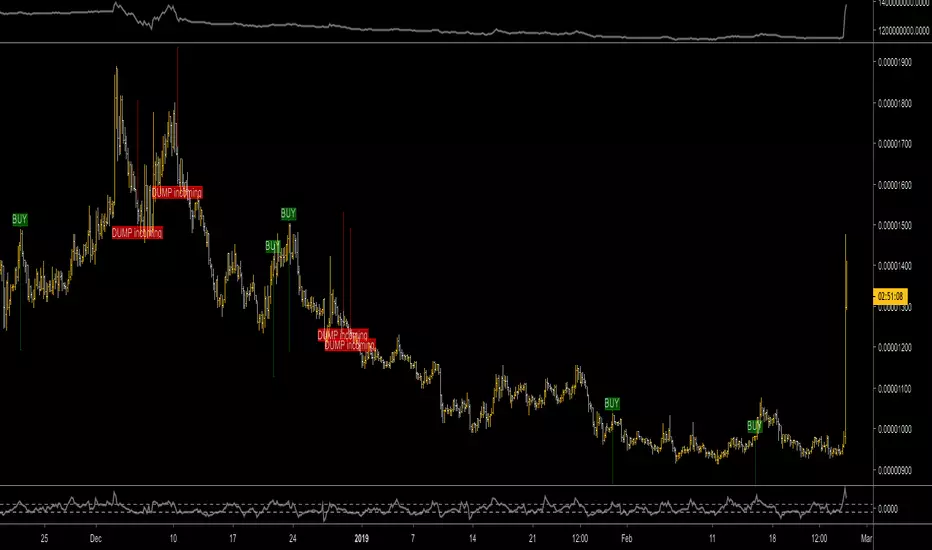
Pump, Dump and Accumulation Tracker (VIP User)ThunderTrader : ThunderLight
ThunderLight is indicator to track or calculate hidden consolidation or accumulation where the whales prepare for next pump
ThunderTrader : ThunderRainbow
ThunderLight is indicator to track or calculate hidden demand, supply and accumulation where the whales prepare for next pump or next dump
Time Frame Rules:
It works for any timeframes below 1W, but some times it will not work for new listing until sufficient data are appeared
TF 30m is very good for entry plan
TF 1H is very good daily tracking
TF 4H is very good for weekly tracking
Disclaimer:
The high demand or high accumulation signal will not immediately trigger the pump. It can take some times, usually TF 1H will trigger the action from 8 to 24 hours.
The high demand or high accumulation signal is not always pump identification but also mini rally or uptrend
The high supply is not alway high dump or end of trend, if it's followed by supply it can continue to pump rally
Alert System:
You can integrate ThunderRainbow or ThunderLight to your Alert System, so that you will not miss the pump by the whales
This is for VIP membership, if you want trial version, please visit:


Volume Extension [DepthHouse]DepthHouse Volume Extension uses average calculations to determine the dynamic range which the volume travels through. Any spike above the line represents an over extension in average volume.
The colored bars are then calculated in a similar way, which measures a combination of both price and volume action to determine bull & bear exhaustion levels, and possible entry/exit points for big players.
This indicator is 100% free , so if you benefit from using it, please consider supporting me by checking out the several other indicators available on my page :)

The People's Indicator Swing TradeThe People's Indicator Swing Trade is the Longer Term Version of the People's Indicator. It will allow you to spot patterns.

Ichimoku A/D Breakoutthis is basically a clone of the super a/d indicator but we're using a standard ichimoku as the source for the trend instead of the supertrend indicator

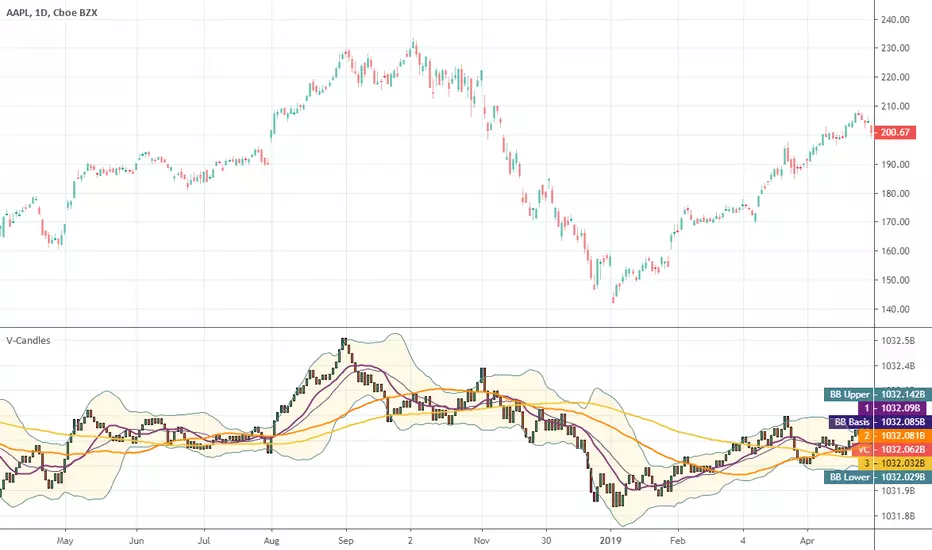
Volume CandlesHello traders!
Well, I was trying to implement EquiVolume Charts that were developed by Richard W. Arms, but unfortunately I got a poor result.
Instead, I used my groundwork on EquiVolumes to create Volume Candles indicator to help you make better, smarter trades.
What are the cool features?
Excellently filters the instrument's movements
Gives a better view of the accumulation/distribution phases
Completely removes price gaps
Works on ANY instrument that has available volume data.
Personally, I am a big fan of the volume-based indicators and to clarify my position I cite the following words of Buff Pelz Dormeier from his book "Investing with Volume Analysis: Identify, Follow, and Profit from Trends" :
A trade produces only two pieces of information: the price and price's neglected sibling, volume. Perhaps the least appreciated piece of the puzzle, volume represents fertile ground for technical analysis. Proficiency in volume analysis is a rare skill. Properly understood, though, volume analysis can provide its practitioner with the power to peer deeply into market mechanics.
Benjamin Graham, the father of value investing and a mentor of Warren Buffett, often called the market a 'voting machine'. If so, then volume is the ballot box. Volume is a literal illustration of the power behind the forces of supply and demand.
Volume is understood as the validation of price, the source of liquidity, the substantiation of information, the fulfillment of convictions, the revelation of divergent opinions, the fuel of the market, the proponent of truth, and the energy behind the velocity of money. If you believe any of this information might be important in making an investment decision, volume analysis is important to you.
I attached some screenshots to show you how it works with other instruments.
Happy Trading!