RSI Divergence UltimateHere it is Everyone - What was once hidden is now revealed
This is the Ultimate RSI Divergence Indicator
Not only does it plot Regular and Hidden Divergence lines for an RSI smoothed by an EMA and for its Signal Line
The RSI can be set to change color with direction or can be set as single color with or with out OB / OS highlights
Color Changing RSI helps when trading Multiple Time Frames as you can look for confluence in the direction of RSI
Included options for the Signal Line include;
Various calculations EMA, SMA and Linear Regression which provides very accurate signal line crossover signals
Color Changing with direction
Second RSI with different Length
Multi Time Frame RSI
Bollinger Bands applied to the RSI
RSI Stochastic that has been compressed to fit into RSI OB / OS so that it doesnt compress the RSI when in these regions
There are also Background Highlights (thanks to Chris Moody) for when the RSI Stochastic moves into OB / OS and crosses its signal line
There are plenty of Alerts for signals with more complex alerts coming soon
I have also added Hima Reddy's Power Zones for support and resistance so now you can also
Take full advantage of trading; signal line crosses, 50 crosses and Power Zone RSI support and resistance and much more
The divergence script is thanks to @RicardoSantos, I've just adjusted it to suite my indicator
Remember that divergences work best when traded with the trend or very late in a trend when going against the trend
Alert

Bones1390's GANN Strategy AlertsThese are the alerts to go along with my GANN Strategy. You can find the strategy here:
If you like my stuff, leave me a comment below.
If you're feeling kind or want to show some appreciation, you can donate Bitcoin to this Address here:
3Jp9Kow1VxvzAiLLwCdeeQ2g11wKyaT4rC
Also if there's anything you want to talk about PM me! I'm free to speak about anything. Want a custom indicator? I can do my best to code it for you!
Thanks!
Bones

[ALERTS] ADX and DIThe average directional index (ADX) is a technical analysis metric. Analysts use it to determine the relative strength of a trend, with the direction of the trend either upwards or downwards.
The Average Directional Index (ADX) along with the Negative Directional Indicator (-DI) and the Positive Directional Indicator (+DI) are momentum strength indicators that evolved for use in stock trading. Commodities trader J. Welles Wilder pioneered their use. Technical traders who use charting techniques want to know when first spotting a shifting trend how strong that trend is and how likely it is to sustain itself over time. The ADX helps investors determine trend strength as they plan their investment strategies.
Confirmation on a chart and other momentum indicators help investors spot trend reversals. But some trends are more potent than others and investors want to better understand the strength of a trend. The ADX identifies a strong positive trend when the ADX is over 25 and a weak trend when the ADX is below 20. Investors can determine directional movement by analyzing the difference between two consecutive low prices and their correlated highs. The movement is +DM when the current high price, less the previous high price, is greater than the previous low price less the current low. The opposite applies in determining the negative or –DI.
When analyzing charts, stock price is the single most important variable to follow. ADX and other indicators are supplementary to price movements in providing additional directional information and support. For example, some of the best trends come about from price range consolidation. It is those tugs of war between buying and selling volumes that lead to breakouts and other trading opportunities.
The Inventor of the Average Directional Index
J. Welles Wilder, Jr. is a former American engineer and real estate developer who went on to revolutionize trading analysis by applying mathematical systems to the world of investing. In addition to developing the ADX, Wilder is also responsible for several other commonly used technical analysis tools including the Average True Range (ATR), the Relative Strength Index (RSI) and the Parabolic SAR.
www.investopedia.com
This script has alerts and includes the filter for markets with no trend defined.
Green Alert --> Long
Red Alert --> Short
Yellow Area --> Weak trend. ADX below threshold
Green candles --> Bullish Market
Red Candles --> Bearish Market
Orange candles --> No defined trend
Enjoy!

[STRATEGY] MA Cross ElevenThis script is a crossing of eleven different MA, with alerts and SL and TP.
The simplest is what works best...
SMA --> Simple
EMA --> Exponential
WMA --> Weighted
VWMA --> Volume Weighted
SMMA --> Smoothed
DEMA --> Double Exponential
TEMA --> Triple Exponential
HMA --> Hull
TMA --> Triangular
SSMA --> SuperSmoother filter
ZEMA --> Zero Lag Exponential
Using "once per bar close" repaint is 0%, but if you like risk can choose "once per bar", better profit.
Thanks to JustUncleL and his amazing sripts.
Enjoy!
www.tradingview.com
"Note: When using non-standard (Renko, Kagi, Line Break, Point and Figure, Heikin Ashi, Spread Charts) types of chart as a basis for strategy, you need to realize that the result will be different. The orders will be executed at the prices of this chart (e.g.for Heikin Ashi it’ll take Heikin Ashi prices (the average ones) not the real market prices). Therefore we highly recommend you to use standard chart type for strategies."

Multiple MA's & Candle Wick AlertsUse this indicator/alerts when a wick touches one of the 5 EMA's (default 20,40,55,100,200 EMA, or you can set other MA types and lengths).
Adjusted by Me for 20,40,55,100,200 EMA, other colors for EMA lines and tiny dots)
Credits to user TradingView user: mgibson91 for base script.


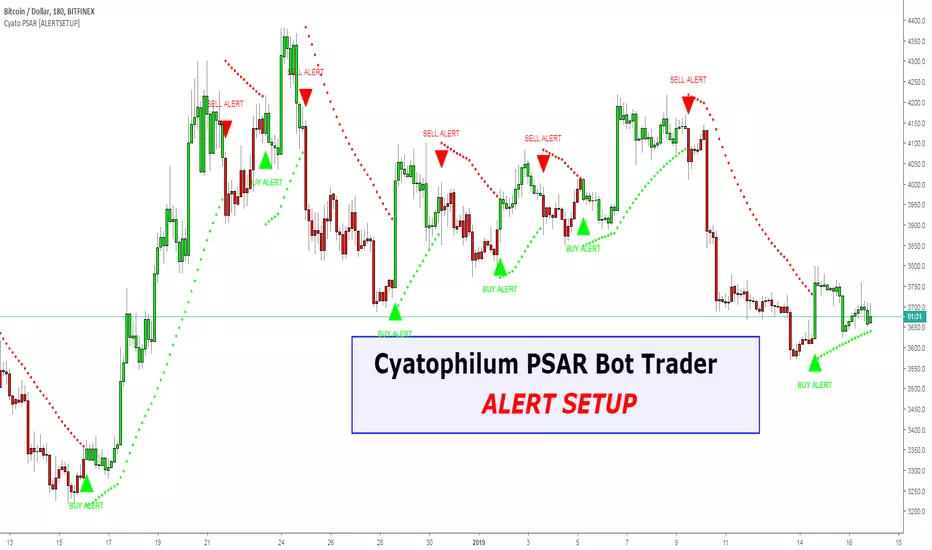
Cyatophilum Trend IndicatorHOW TO USE
Step 1 : Adjust the Trend Parameter to the most profitable number.
Step 2 : Create Automatic Alerts for Buy (L) and Sell (S) signals.
BONUS :
Trend horizontal Line: Use this line to avoid risky trades.
Get This Indicator Today!
Purchase at blockchainfiesta.com
SAMPLE USE CASES
BTCUSD 1 D
BTCUSD 4 h
ETHUSD 1 D
ETH/BTC 1 D
Get This Indicator Today!
Purchase at blockchainfiesta.com
View a video tutorial on how to use this indicator at the link above.
Have Fun !
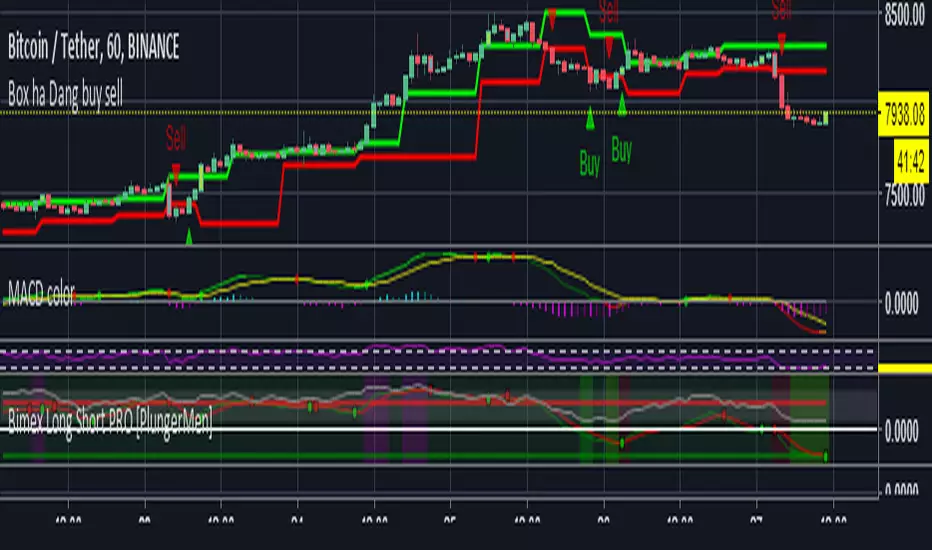
lamBOTghini-ALERTador & SL/TP V3Es un algoritmo de combinación de EMAs.
Si utilizas “close” en las 3 EMA como fuente repintará más (aunque repintar es otra cosa pero para que se entienda) aunque gráficamente parezca la mejor opción.
Por el contrario, si utilizas “high” u “open” el repintado es inexistente pero se pierde rentabilidad.
Así que es ir probando, aunque para mi esta es la más equilibrada. Tú eliges...
Tiene una alerta doble Buy / Sell para los que no son pro y solo pueden poner una solamente.
Lleva como siempre Take profit y Stop Loss, aunque el Stop Loss mejor en el Exchange.


08-2018 Stochastic 5m [ALERT SETUP] [INDICATOR]This is an accumulation of small buy orders and a complete sell order strategy, that can be used for manual trading or for a trading bot. The strategy is based on stockastic divergences ( an indicator that I made myself and is published on my profile earlier ), and I added my personnal touch of course. Note that the bullish and bearish stochastic divergences are calculated separately and can be configured in the inputs.
To be used with a 5m timeframe, and on a flat or bullish pair.
Everyone can favorite the script, apply it to the chart, but only I can see or modify the code. If you need anything, leave a comment, thanks :D
More info about the script, such as inputs description, how to configure the script, strategy explanation, alert configuration can be found here : blockchainfiesta.com
--------------------------------------------------------------------------------------------------------------
I do commission work: TradingView Pine Script development & Reverse Engineering.
contact@blockchainfiesta.com.
You can also send me a message in TradingView or Discord (discord.gg)
Bitcoin address: 19sVQvCDmVfEACq7BiMnWSMqFPZ8qfSQ2K
ETH address: 0xc8a5d3a63a05db0c2363ea1c08b37a01cce9ebfb

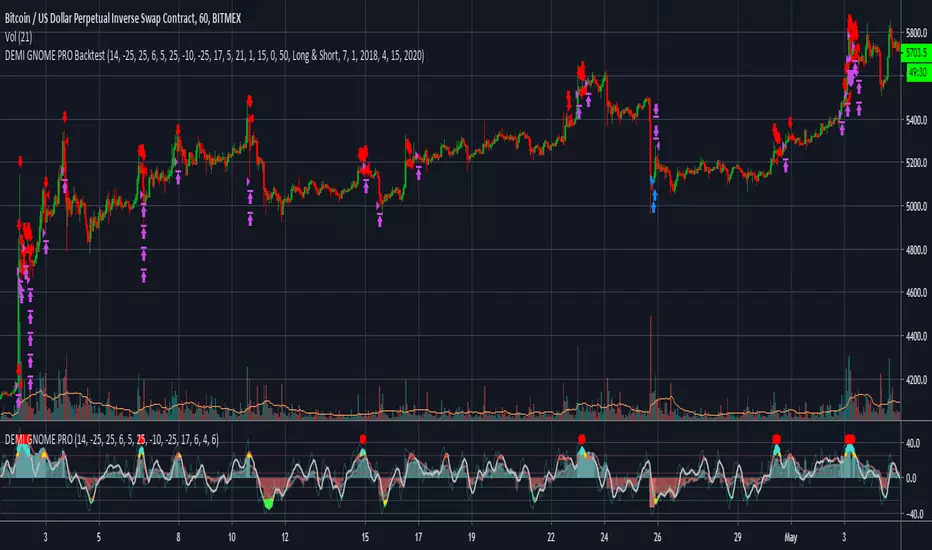
DEMI GNOME PROHello Fellow Traders!
-------------------------------------------
This is the newest addition to Gnome Alerts PRO
This is one of the newer scripts that we are using for scalping on the lower time frames on Bitmex & Binance.
This is a transformed version of GODMODE that adapts to market swings.
INCLUDES:
------------------------
*Autoview Ready*
BUY ALERTS
- multiple long positions
SELL ALERTS
- sell with oversold alerts
- sell based of %gain
Short Alerts For Bitmex
Backtesting is also available!
More info on how gain access in my profile!
Market Sniper Signal MTF [ALERTS]Script with alert condition to use with Market Sniper Strategy.
Can be used to trade manually or automatically using API/AutoView Extension.
Market Sniper is a multi-timeframe strategy based on trend analysis created to operate on leverage market.
Code is still in beta-testing, please leave a comment if you want a free trial when final release will be available.

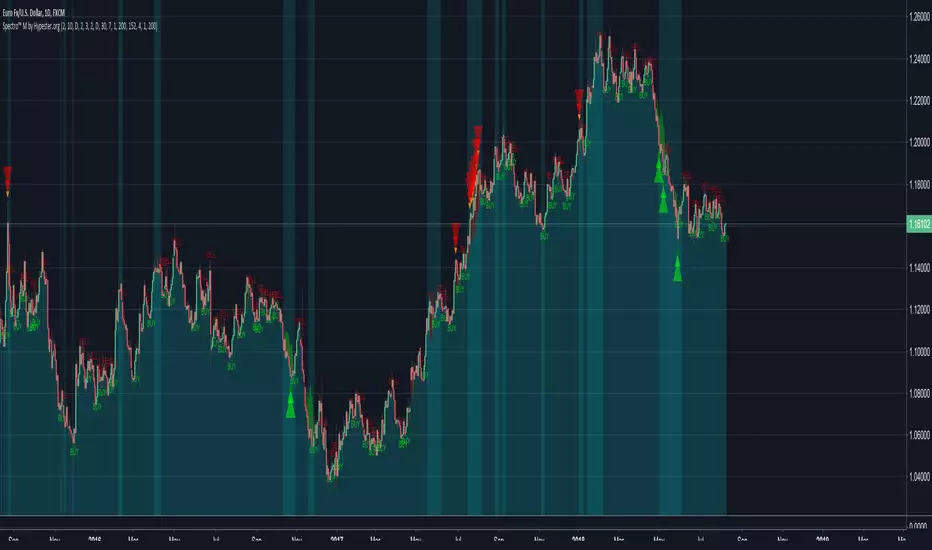
Spectro™ ScreenerNow Spectro™ technology helps you find and trade several assets with one look.
08/08/18 - Beta test v1 is published
08-18 EMA Watson [ALERT SETUP][INDICATOR]Hello here is the Alert Setup of my Strategy EMA Watson, I published a backtest version on my profile two days ago.
The big triangles correspond to the buy/sell alerts.
I give access for free, just leave a comment.
More info about the script, such as inputs description, how to configure the script, strategy explanation, alert configuration can be found here : blockchainfiesta.com
--------------------------------------------------------------------------------------------------------------
Commission Work: TradingView development, Reverse Engineering, Pine Script. contact@blockchainfiesta.com.. You can also send me a message in TradingView or Discord
If you have too much crypto and want to help me out:
BTC -2.19% address: 19sVQvCDmVfEACq7BiMnWSMqFPZ8qfSQ2K
ETH address: 0xc8a5d3a63a05db0c2363ea1c08b37a01cce9ebfb

BitMEX Volatility AlertsAlert conditions and bar colors for each of the three volatility indices from BitMEX.
Price: 0.002 BTC / 35 Ripples / 1 NEO

[STUDY]HullMA OCC & SL/TP V3Another Open Close Cross. Now with Hull Moving Average: Alerts, SL TP, ...
Best results at 4h.
Enjoy!

Volume w/ Threshold and Editable MA PeriodJust a simple script that tweaks the original Volume one.
The purpose is creating a threshold which we'll use to put an alert on. This way, we can be notified whether Volume pumps.
Useful for spotting breakouts, breakdowns and pumps.
Threshold is simply a coeff * ma(volume,period). Coeff is editable as well.
Hope this helps!

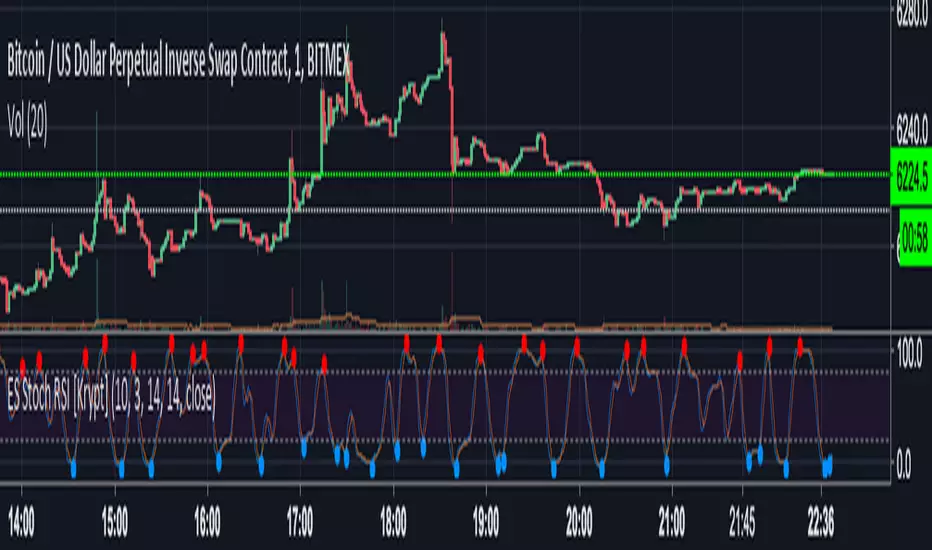
Ehlers-Smoothed Stochastic RSI AlertES Stoch RSI Alert for use with AutoView using script by fskrypt.
Sell Alert <=20.0
Buy Alert >=80.0