Volatility Smoothed Moving Average BandsThe Volatility Smoothed Moving Average Bands are volatility based bands that combine multiple measures to get an accurate signal on the market trend.
The Benefits
- Low noise due to accuracy averaging
- Fast Speed
- Good altcoin performance, mainly on CRYPTO:CROUSD
The Idea
The idea is to provide high accuracy signals with high robustness with averaging multiple sources that do not require extra history, using the same amount of data with higher accuracy
How it works
It first calculates a more reactive and a less reactive MA. It starts combining the MAs and averages all the returned values for maximum accuracy.
Then it subtracts everything from everything, and the average is the volatility for the bands.
It adds that on top of the base and creates highly accurate bands.
Enjoy Gs!
Altcoins

Moving Average Divergence BandsThe Moving Average Divergence Bands are a new trend following tool designed for catching ALT coin trends quickly, while filtering away false signals.
The Benefits
- Very fast altcoin entries
- Highly consistent past returns (mainly CRYPTO:SOLUSD ), with both long & shorts profitable
- Lack of false signals due to Z-Score based filtering
- High tier of parameter robustness
The Idea
The idea is simple:
Get high speed & low noise bands that adapt to market conditions, allowing entries only during environments that have a potential reward and less risk. This unique filtering provides users with fast entries and low amount of false signals.
How it works
The indicator gets 2 Moving Averages, one normal, one with half the lookback.
It then combines them using powers and dividing and returns the higher result for the upper band, and the lower for the lower band.
Then it calculates the Z-Score of the source and if both the absolute Z-Score & Long/Short condition are true then it switches the trend.
Enjoy Gs!

CRUX-3 Macro Regime Index"CRUX-3 Macro Regime Index"
Description:
CRUX-3 Macro Regime Index is a higher-timeframe macro indicator designed to evaluate how crypto markets are performing relative to traditional equities. It compares Bitcoin, Ethereum, and the broader altcoin market (TOTAL3) against the S&P 500 using Z-score normalization to highlight periods of relative outperformance or underperformance.
The indicator incorporates liquidity-based regime detection using Bitcoin dominance and stablecoin dominance to classify market environments as Risk-On, BTC-Led, or Risk-Off. Background shading visually highlights these regimes, helping users identify broader macro conditions rather than short-term trade signals.
CRUX-3 is intended for macro context, regime awareness, and allocation bias decisions, not for precise trade entries or timing.
How to Use:
Weekly timeframe recommended for best results
Rising Z-scores indicate crypto outperforming equities
ETH/SPX typically acts as an early rotation signal
TOTAL3/SPX confirms broader altcoin participation
Regime shading reflects liquidity conditions, not price forecasts
Regime Definitions:
Risk-On: BTC dominance and stablecoin dominance declining
BTC-Led: BTC dominance strong while stablecoin dominance eases
Risk-Off: BTC dominance and stablecoin dominance rising
Notes:
Forward regime bands are statistical reference guides based on historical behavior
This indicator does not predict future prices or market direction
Best used alongside price charts and other macro tools
Disclaimer:
This indicator is for educational and informational purposes only. It does not constitute financial advice, investment advice, or trading recommendations.
Recommended Settings:
Timeframe: Weekly (1W)
Z-Score Lookback: 52
Forward Regime Bands: Enabled

Crypto Breadth Engine [alex975]
A normalized crypto market breadth indicator with a customizable 40 coin input panel — revealing whether rallies are broad and healthy across major coins and altcoins or led by only a few.
📊 Overview
The Crypto Breadth Engine measures the real participation strength of the crypto market by analyzing the direction of the 40 largest cryptocurrencies by market capitalization.
⚙️ How It Works
Unlike standard breadth tools that only count assets above a moving average, this indicator measures actual price direction:
+1 if a coin closes higher, –1 if lower, 0 if unchanged.
The total forms a Breadth Line, statistically normalized using standard deviation to maintain consistent readings across timeframes and volatility conditions.
🧩 Dynamic Input Mask
All 40 cryptocurrencies are fully editable via the input panel, allowing users to easily replace or customize the basket (Top 40, Layer-1s, DeFi, Meme Coins, AI Tokens, etc.) without touching the code.
This flexibility keeps the indicator aligned with the evolving crypto market.
🧭 Trend Bias
The indicator classifies market structure as Bullish, Neutral, or Bearish, based on how the Breadth Line aligns with its moving averages (10, 20, 50).
💡 Dashboard
A compact on-chart table displays in real time:
• Positive and negative coins
• Participation percentage
• Current trend bias
🔍 Interpretation
• Rising breadth → broad, healthy market expansion
• Falling breadth → narrowing participation and structural weakness
Ideal for TOTAL, TOTAL3, or custom crypto baskets on 1D,1W.
Developed by alex975 – Version 1.0 (2025).
-------------------------------------------------------------------------------------
🇮🇹 Versione Italiana
📊 Panoramica
Il Crypto Breadth Engine misura la partecipazione reale del mercato crypto, analizzando la direzione delle 40 principali criptovalute per capitalizzazione.
Non si limita a contare quante coin sono sopra una media mobile, ma calcola la variazione effettiva del prezzo:
+1 se sale, –1 se scende, 0 se invariato.
La somma genera una Breadth Line normalizzata statisticamente, garantendo letture coerenti su diversi timeframe e fasi di volatilità.
🧩 Mascherina dinamica
L’indicatore include una mascherina d’input interattiva che consente di modificare o sostituire liberamente i 40 ticker analizzati (Top 40, Layer-1, DeFi, Meme Coin, ecc.) senza intervenire nel codice.
Questo lo rende sempre aggiornato e adattabile all’evoluzione del mercato crypto.
⚙️ Funzionamento e Trend Bias
Classifica automaticamente il mercato come Bullish, Neutral o Bearish in base alla relazione tra la breadth e le medie mobili (10, 20, 50 periodi).
💡 Dashboard
Una tabella compatta mostra in tempo reale:
• Numero di coin positive e negative
• Percentuale di partecipazione
• Stato attuale del trend
🔍 Interpretazione
• Breadth in crescita → mercato ampio e trend sano
• Breadth in calo → partecipazione ridotta e concentrazione su pochi asset
Ideale per analizzare TOTAL, TOTAL3 o panieri personalizzati di crypto.
Funziona su timeframe 1D, 4H, 1W.
Sviluppato da alex975 – Versione 1.0 (2025).

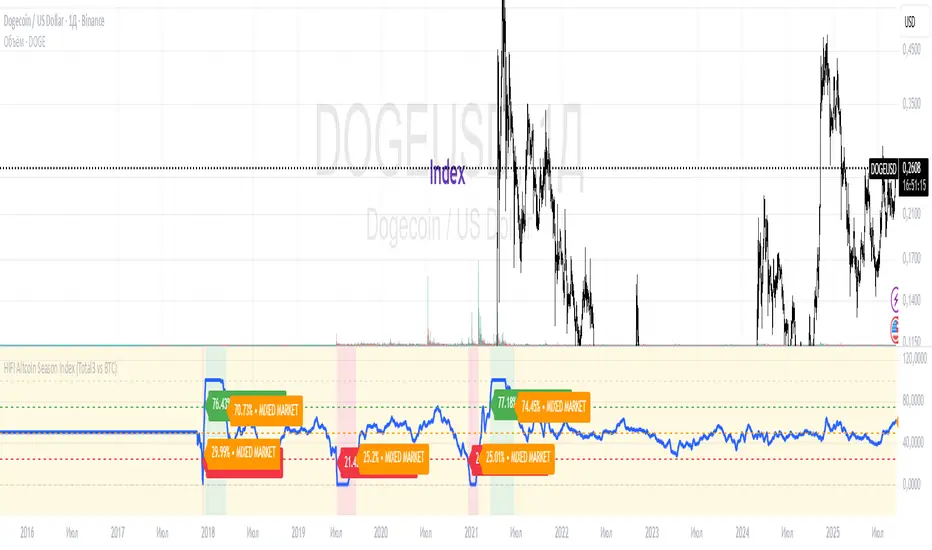
HIFI Altcoin Season Index (Total3 vs BTC)This indicator helps you determine whether the crypto market is in an "altcoin season" or a "bitcoin season." It doesn't compare every single altcoin to Bitcoin individually; instead, it uses a more efficient approach.
Methodology
The index calculates the difference in price performance over a selected period (default 90 days) between the total market capitalization of altcoins without Ethereum (TOTAL3) and Bitcoin (BTC).
Interpretation
Value above 75: TOTAL3 is showing significantly stronger growth than BTC, indicating an ALTCOIN SEASON. 🚀
Value below 25: BTC is outperforming TOTAL3, indicating a BITCOIN SEASON. 👑
Value between 25 and 75: The market is in a mixed or neutral phase. 🤷
Benefits
This method avoids the technical limitations of Pine Script when requesting data for a large number of symbols, making the indicator stable and reliable.
Disclaimer: This indicator is a tool for market analysis and should not be considered financial advice.
EMA 200 Monitor - Bybit CoinsEMA 200 Monitor - Bybit Coins
📊 OVERVIEW
The EMA 200 Monitor - Bybit Coins is an advanced indicator that automatically monitors 30 of the top cryptocurrencies traded on Bybit, alerting you when they are close to the 200-period Exponential Moving Average on the 4-hour timeframe.
This indicator was developed especially for traders who use the EMA 200 as a key support/resistance level in their swing trading and position trading strategies.
🎯 WHAT IT'S FOR
Multi-Asset Monitoring: Simultaneous monitoring of 30 cryptocurrencies without having to switch between charts
Opportunity Identification: Detects when coins are approaching the 200 EMA, a crucial technical level
Automated Alerts: Real-time notifications when a coin reaches the configured proximity
Time Efficiency: Eliminates the need to manually check chart collections
⚙️ HOW IT WORKS
Main Functionality
The indicator uses the request.security() function to fetch price data and calculate the 200 EMA of each monitored asset. With each new bar, the script:
Calculates the distance between the current price and the 200 EMA for each coin
Identifies proximity based on the configured percentage (default: 2%)
Displays results in a table organized on the chart
Generates automatic alerts when proximity is detected
Monitored Coins
Major : BTC, ETH, BNB, ADA, XRP, SOL, DOT, DOGE, AVAX
DeFi : UNI, LINK, ATOM, ICP, NEAR, OP, ARB, INJ
Memecoins : SHIB, PEPE, WIF, BONK, FLOKI
Emerging : SUI, TON, APT, POL (ex-MATIC)
📋 AVAILABLE SETTINGS
Adjustable Parameters
EMA Length (Default: 200): Exponential Moving Average Period
Proximity Percentage (Default: 2%): Distance in percentage to consider "close"
Show Table (Default: Active): Show/hide results table
Table Position: Position of the table on the chart (9 options available)
Color System
🔴 Red: Distance ≤ 1% (very close)
🟠 Orange: Distance ≤ 1.5% (close)
🟡 Yellow: Distance ≤ 2% (approaching)
🚀 HOW TO USE
Initial Configuration
Add the indicator to the 4-hour timeframe chart
Set the parameters according to your strategy
Position the table where there is no graphic preference
Setting Alerts
Click "Create Alert" in TradingView
Select the "EMA 200 Monitor" indicator
Set the notification frequency and method
Activate the alert to receive automatic notifications
Results Interpretation
The table shows:
Coin: Asset name (e.g. BTC, ETH)
Price: Current currency quote
EMA 200: Current value of the moving average
Distance: Percentage of proximity to the core code
💡 STRATEGIES TO USE
Reversal Trading
Entry: When price touches or approaches the EMA 200
Stop: Below/above the EMA with a safety margin
Target: Previous resistance/support levels
Breakout Trading
Monitoring: Watch for currencies consolidating near the EMA 200
Entry: When the media is finally broken
Confirmation: Volume and close above/below the EMA
Swing Trading
Identification: Use the monitor to detect setups in formation
Timing: Wait for the EMA 200 to approach for detailed analysis
Management: Use the EMA as a reference for stops dynamics
⚠️ IMPORTANT CONSIDERATIONS
Technical Limitations
Request Bybit data: Access to exchange symbols required
Specific timeframe: Optimized for 4-hour analysis
Minimum delay: Data updated with each new bar
Usage Recommendations
Combine with technical analysis: Use together with other indicators
Confirm the configuration: Check the graphic patterns before trading
Manage risk: Always use stop loss and adequate position sizing
Backtesting: Test your strategy before applying with real capital
Disclaimer
This indicator is a technical analysis tool and does not constitute investment advice. Always do your own analysis and manage detailed information about the risks of your operations.
🔧 TECHNICAL INFORMATION
Pine Script version: v6
Type: Indicator (overlay=true)
Compatibility: All TradingView plans
Resources used: request.security(), arrays, tables
Performance: Optimized for multiple simultaneous queries
📈 COMPETITIVE ADVANTAGES
✅ Simultaneous monitoring of 30 major assets ✅ Clear visual interface with intuitive core system ✅ Customizable alerts for different details ✅ Optimized code for maximum performance ✅ Flexible configuration adaptable to different strategies ✅ Real-time update without the need for manual refresh
Developed for traders who value efficiency and accuracy in identifying market opportunities based on the EMA 20

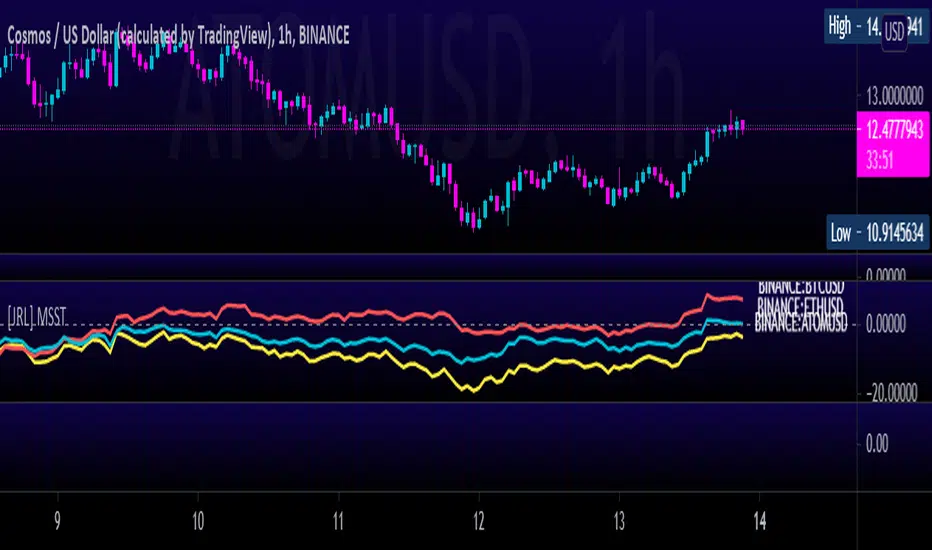
ZenAlgo - DominatorThis indicator provides a structured multi-ticker overview of market momentum and relative strength by analyzing short-term price behavior across selected assets in comparison with broader crypto dominance and Bitcoin/ETH performance.
Ticker and Market Data Handling
The script accepts up to 9 user-defined symbols (tickers) along with BTCUSD and ETHUSD. For each symbol:
It retrieves the current price.
It also requests the daily opening price from the "D" timeframe to compute intraday percentage change.
For BTC, ETH, and dominance (sum of BTC, USDT, and USDC dominance), daily change is calculated using this same method.
This comparison enables tracking relative performance from the daily open, which provides meaningful insight into intraday strength or weakness among different assets.
Dominance Logic
The indicator aggregates dominance data from BTC , USDT , and USDC using TradingView’s CRYPTOCAP indices. This combined dominance is used as a reference in directional and status calculations. ETH dominance is also analyzed independently.
Changes in dominance are used to infer whether market attention is shifting toward Bitcoin/stablecoins (typically indicating risk-off sentiment) or away from them (typically risk-on behavior, benefiting altcoins).
Price Direction Estimation
The script estimates directional bias using an EMA-based deviation technique:
A short EMA (user-defined lookback , default 4 bars) is calculated.
The current close is compared to the EMA to assess directional bias.
Recent candle changes are also inspected to confirm a consistent short-term trend (e.g., 3 consecutive higher closes for "up").
A small threshold is used to avoid classifying flat movements as trends.
This directionality logic is applied separately to:
The selected ticker's price
BTC price
Combined dominance
This allows the script to contextualize the movement of each asset within broader market conditions.
Market Status Evaluation
A custom function analyzes ETH and BTC dominance trends along with their relative strength to define the overall market regime:
Altseason is identified when BTC dominance is declining, ETH dominance rising, and ETH outperforms BTC.
BTC Season occurs when BTC dominance is rising, ETH dominance falling, and BTC outperforms ETH.
If neither condition is met, the state is Neutral .
This classification is shown alongside each ticker's row in the table and helps traders assess whether market conditions favor Bitcoin, Ethereum, or altcoins in general.
Ticker Status Classification
Each ticker is analyzed independently using the earlier directional logic. Its status is then determined as follows:
Full Bull : Ticker is trending up while dominance is declining or BTC is also rising.
Bullish : Ticker is trending up but not supported by broader bullish context.
Bearish : Ticker is trending down but without broader confirmation.
Full Bear : Ticker is trending down while dominance rises or BTC falls.
Neutral : No strong directional bias or conflicting context.
This classification reflects short-term momentum and macro alignment and is color-coded in the results table.
Table Display and Plotting
A configurable table is shown on the chart, which:
Displays the name and status of each selected ticker.
Optionally includes BTC, ETH, and market state.
Uses color-coding for intuitive interpretation.
Additionally, price changes from the daily open are plotted for each selected ticker, BTC, ETH, and combined dominance. These values are also labeled directly on the chart.
Labeling and UX Enhancements
Labels next to the current candle display price and percent change for each active ticker and for BTC, ETH, and combined dominance.
Labels update each bar, and old labels are deleted to avoid clutter.
Ticker names are dynamically shortened by stripping exchange prefixes.
How to Use This Indicator
This tool helps traders:
Spot early rotations between Bitcoin and altcoins.
Identify intraday momentum leaders or laggards.
Monitor which tickers align with or diverge from broader market trends.
Detect possible sentiment shifts based on dominance trends.
It is best used on lower to mid timeframes (15m–4h) to capture intraday to short-term shifts. Users should cross-reference with longer-term trend tools or structural indicators when making directional decisions.
Interpretation of Values
% Change : Measures intraday move from daily open. Strong positive/negative values may indicate breakouts or reversals.
Status : Describes directional strength relative to market conditions.
Market State : Gives a general bias toward BTC dominance, ETH strength, or altcoin momentum.
Limitations & Considerations
The indicator does not analyze liquidity or volume directly.
All logic is based on short-term movements and may produce false signals in ranging or low-volume environments.
Dominance calculations rely on external CRYPTOCAP indices, which may differ from exchange-specific flows.
Added Value Over Other Free Tools
Unlike basic % change tables or price overlays, this indicator:
Integrates dominance-based macro context into ticker evaluation.
Dynamically classifies market regimes (BTC season / Altseason).
Uses multi-factor logic to determine ticker bias, avoiding single-metric interpretation.
Displays consolidated information in a table and chart overlays for rapid assessment.

Regime Filter IndicatorRegime Filter – Crypto Market Trend Indicator
📊 Overview
The Regime Filter is a powerful market analysis indicator designed specifically for crypto trading. It helps traders identify whether the market is in a bullish or bearish phase by analyzing key assets in the cryptocurrency market, including Bitcoin (BTC), Bitcoin Dominance (BTC.D), and the Altcoin Market (TOTAL3). The indicator compares these assets against their respective Simple Moving Averages (SMA) to determine the overall market regime, allowing traders to make more informed decisions.
🔍 How It Works
The Regime Filter evaluates three main components to determine the market's sentiment:
1. BTC Dominance (BTC.D) vs. 40 SMA (Medium Timeframe)
The Bitcoin Dominance (BTC.D) is compared to its 40-period SMA on a mid-timeframe (e.g.,
1-hour). If BTC.D is below the 40 SMA, it indicates that altcoins are performing well relative
to Bitcoin, suggesting a bullish altcoin market. If BTC.D is above the 40 SMA, Bitcoin is
gaining dominance, indicating a potential bearish phase for altcoins.
2. TOTAL3 Market Cap vs. 100 SMA (Medium Timeframe)
The TOTAL3 index, which tracks the total market capitalization of all cryptocurrencies except
Bitcoin and Ethereum, is compared to its 100-period SMA. A bullish signal occurs when TOTAL3
is above the 100 SMA, indicating strength in altcoins, while a bearish signal occurs when
TOTAL3 is below the 100 SMA, signaling a potential weakness in the altcoin market.
3. BTC Price vs. 200 SMA (Higher Timeframe)
The current Bitcoin price is compared to its 200-period Simple Moving Average (SMA) on a
higher timeframe (e.g., 4-hour). A bullish signal is given when the BTC price is above the 200
SMA, and a bearish signal when it's below.
🟢 Bullish Market Conditions
The market is considered bullish when:
- BTC Dominance (BTC.D) is below the 40 SMA, suggesting altcoins are gaining momentum.
- TOTAL3 Market Cap is above the 100 SMA, signaling strength in the altcoin market.
- BTC price is above the 200 SMA, indicating an uptrend in Bitcoin.
In these conditions, the background turns green 🟢, and a "Bullish" label is displayed on the chart.
🔴 Bearish Market Conditions
The market is considered bearish when:
- BTC Dominance (BTC.D) is above the 40 SMA, indicating Bitcoin is outperforming altcoins.
- TOTAL3 Market Cap is below the 100 SMA, signaling weakness in altcoins.
- BTC price is below the 200 SMA, indicating a downtrend in Bitcoin.
In these conditions, the background turns red 🔴, and a "Bearish" label appears on the chart.
⚙ Customization Options
- The Regime Filter offers flexibility for traders:
- Enable or Disable Specific SMAs: Customize the indicator by enabling or disabling the 200 SMA for Bitcoin, the 40 SMA for BTC Dominance, and the 100 SMA for TOTAL3.
- Adjust Timeframes: Choose the timeframes for each of the moving averages to suit your preferred trading strategy.
- Real-Time Data Adjustments: The indicator updates in real-time to reflect current market conditions, ensuring timely analysis.
📈 Best Use Cases
- Trend Confirmation: The Regime Filter is ideal for confirming the market's overall trend,
helping traders to align their positions with the dominant market sentiment.
- Trade Entry/Exit Signals: Use the indicator to identify favorable entry or exit points based on
whether the market is in a bullish or bearish phase.
- Market Overview: Gain a quick understanding of the broader crypto market, with a focus on
Bitcoin and altcoins, to make more strategic decisions.
⚠️ Important Notes
Trend-Following Indicator: The Regime Filter is a trend-following tool, meaning it works best in strong trending markets. It may not perform well in choppy, sideways markets.
Risk Management: This indicator is designed to assist in identifying market trends, but it does not guarantee profits. Always apply sound risk management strategies and use additional indicators when making trading decisions.
Not a Profit Guarantee: While this indicator can help identify potential market trends, no trading tool or strategy guarantees profits. Please trade responsibly and ensure that your decisions are based on comprehensive analysis and risk tolerance.

Altcoin Total Average Divergence (YavuzAkbay)The "Average Price and Divergence" indicator is a strong tool built exclusively for cryptocurrency traders who understand the significance of comparing altcoins to Bitcoin (BTC). While traditional research frequently focusses on the value of cryptocurrencies against fiat currencies such as the US dollar, this indicator switches the focus to the value of altcoins against Bitcoin itself, allowing you to detect potential market opportunities and divergences.
The indicator allows you to compare the price of an altcoin to Bitcoin (e.g., ETHBTC, SOLBTC), which is critical for determining how well an altcoin performs against the main cryptocurrency. This is especially important for investors who expect Bitcoin's price will continue to rise logarithmically and want to ensure that their altcoin holdings retain or expand in market capitalisation compared to Bitcoin.
The indicator computes the average price of the chosen cryptocurrency relative to Bitcoin over the viewable portion of the chart. This average acts as a benchmark, indicating the normal value around which the altcoin's price moves.
The primary objective of this indicator is to calculate and plot the divergence, which is the difference between the altcoin's current price relative to Bitcoin and its average value. This divergence can reveal probable overbought or oversold conditions, allowing traders to make better decisions about entry and exit points.
The divergence is represented as a histogram, with bars representing the magnitude of the difference between the current and average prices. Positive values indicate that the altcoin is trading above its average value in comparison to Bitcoin, whereas negative values indicate that it is trading below its average.
The indicator automatically adjusts to the chart's visible range, ensuring that the average price and divergence are always calculated using the most relevant data. This makes the indicator extremely sensitive to changes in the chart view and market conditions.
How to Use:
A significant positive divergence may imply that the cryptocurrency is overbought in comparison to Bitcoin and is headed for a correction. A significant negative divergence, on the other hand, may indicate that the cryptocurrency has been oversold and is cheap in comparison to Bitcoin.
Tracking how an altcoin's price deviates from its average relative to Bitcoin can provide insights about the market's opinion towards that altcoin. Persistent positive divergence may suggest high market confidence, whilst constant negative divergence may imply a lack of interest or eroding fundamentals.
Use divergence data to better time your trades, either by entering when a cryptocurrency is discounted in comparison to its average (negative divergence) or departing when it is overpriced (positive divergence). This allows you to capture value as the price returns to its mean.
Ideal For:
Cryptocurrency Traders who want to understand how altcoins are performing relative to Bitcoin rather than just against fiat currencies.
Long-term Investors looking to ensure their altcoin investments are maintaining or growing their value relative to Bitcoin.
Market Analysts interested in identifying potential reversals or continuations in altcoin prices based on divergence from their average value relative to Bitcoin.

Altcoin ManagerThe Altcoin Manager is a comprehensive script for identifying the current altcoin narrative by tracking and analyzing of a wide array of altcoins across various blockchain layers and categories, such as DeFi, GameFi, AI, and Meme coins. Ideal for traders looking to get a broad yet detailed view of the altcoin market, covering various sectors and chains.
The Key Features:
Versatile Asset Tracking:
Tracks 40 different cryptocurrencies (as of publishing) across different categories, allowing for a diversified and detailed analysis of the altcoin market.
Customizable Assets and Category Analysis:
Select 20 of your own coins across 4 different categories such as DeFi, GameFi, AI, and Meme coins as well as specifying their individual chains.
Dynamic Layer and Chain Analysis:
Includes options to plot and analyze specific blockchain layers and chains such as Ethereum Chain, Solana Chain, BNB Smart Chain, Arbitrum Chain, and Polygon Chain. The script associates various assets with specific blockchains, providing a clearer picture of how different segments of the altcoin market are performing.
Cumulative and Per-Candle Change:
Switch between viewing the total cumulative change since a set start date or the per-candle change, offering flexibility in analyzing price movements over different timeframes.
Denomination Adjustment:
Includes a functionality to denominate asset prices in other currencies or crypto such as BTC, allowing for a more tailored financial analysis according to your preference.
Moving Averages for Categories and Chains:
Calculates and plots moving averages for each category and chain, aiding in the identification of trends over the selected moving average length.
How do I use it?
This script is not used with any particular chart. Instead, assign it it's own tab and layout.
For a clearer analysis, use multiple different panels to track Categories and Chains separately, both Cumulative for a longer term analysis and Per-Candle to find ongoing breakouts and changes in trend.
You can either use the pre-selected altcoins to represent the market, or you can select your own.
The Layer 1 and Layer 2 are not customizable but consists of 15 popular Layer 1 incl Bitcoin, Ethereum, Solana etc. Layer 2 consists of 5 popular Layer 2.

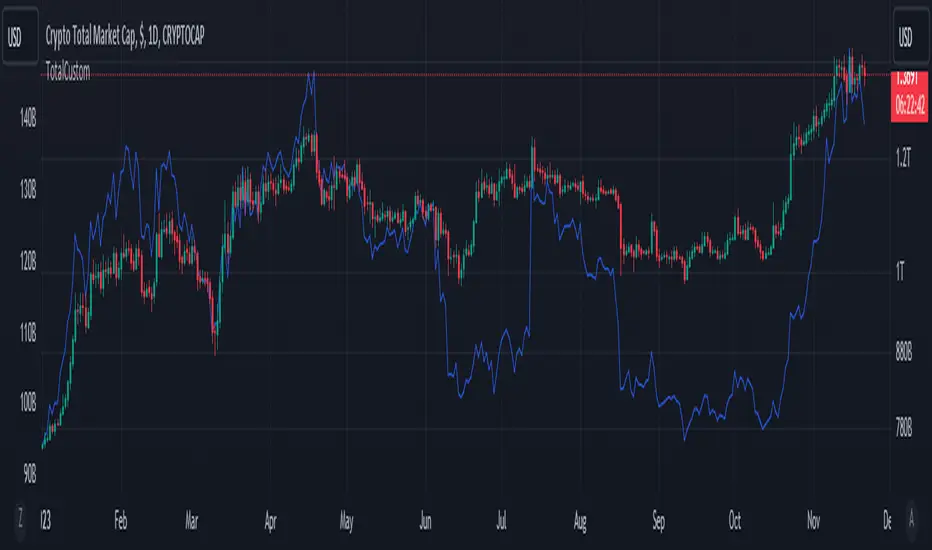
TotalCustomTotalCustom sums our custom altcoin list's market caps together.
Primarily used to compare to the following:
A. price of bitcoin
B. Total 1, Total 2, Total 3
Used in the following way:
When there is a large gap on fixed time frames (i.e. 3 month, 6 month, YTD) between this indicator and the main comparisons, it is generally considered a good time to buy.
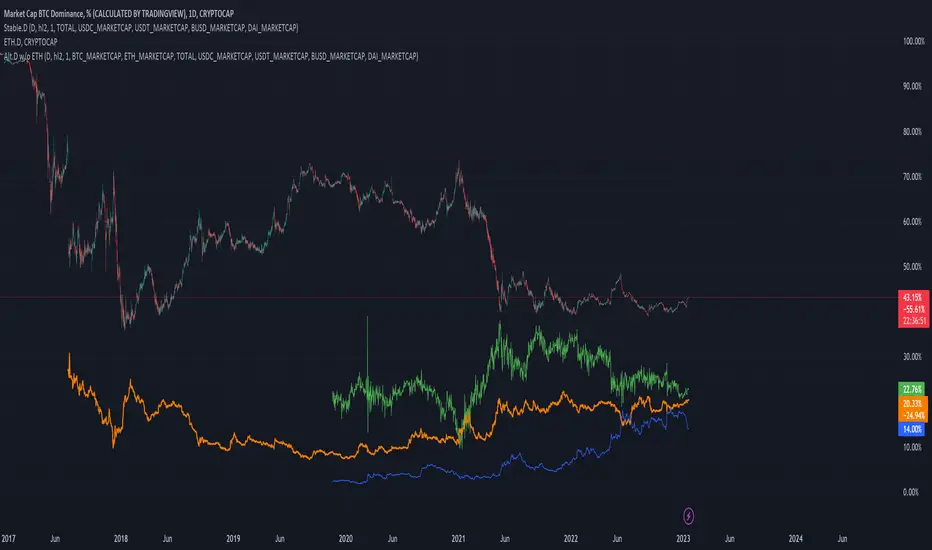
Degen Dominator - (Crypto Dominance Tool) - [mutantdog]A fairly simple one this time. Another crypto dominance tool, consider it a sequel to Dominion if you will. Ready to go out-of-the-box with a selection of presets at hand.
The premise is straightforward, rather than viewing the various marketcap dominance indexes as their standard percentage values, here we have them represented as basic oscillators. This allows for multiple indexes to be viewed in one pane and gives a decent overview of their relative changes and thus the flow of capital within the overall crypto market. As a general rule-of-thumb, when a plot is above zero then the dominance is climbing, thus capital is likely flowing in that direction. The inverse applies when below zero. When the market is quiet, all will be close to zero. Basic overbought/oversold conditions can also be inferred too.
Active as default are:
Bitcoin (0range): CRYPTOCAP:BTC.D
Ethereum (Blue): CRYPTOCAP:ETH.D
Stablecoins (Red): CRYPTOCAP:USDT.D + CRYPTOCAP:USDC.D
Altcoins (Green): 100 - (all of the above)
These are plotted according to the selected oscillator preset and it's length parameter. The default is set to 'EMA Centre'. An optional RMA(3) smoothing filter is also included and active as default. Each index plot has its own colour and opacity settings available on the main page.
Additionally, the following are also available (deactivated as default):
Total DeFi : CRYPTOCAP:TOTALDEFI.D
Current Symbol : Will try to match corresponding dominance index for the chart symbol if available.
Custom Input : Manual text input, will try to match if available.
-------------
The included presets determine the oscillator type used, all are fairly simple and easy to interpret:
EMA Centre
SMA Centre
Median Centre
Midrange Centre
The first 4 are all variations on the same theme, simply calculated as the difference between the actual value and its respective average. EMA is the default and is my personal preference, if you generally favour using an SMA then perhaps that would be your better choice. Like the two MAs, median and midrange are also dependant on the length parameter. Midrange is calculated from the difference between highest and lowest values within the length period, with a little extra smoothing from an RMA(3).
Simple Delta
Weighted Delta
Running Delta
Often referred to as momentum, delta is just change over time. 'Simple' is the most basic of these, the difference between the current value and the value (length) bars prior. A more long-winded way of calculating this would be to take the difference between each bar and its previous then average them with an SMA which results in the same value. 'Weighted' adopts that principle but instead uses a WMA, likewise 'Running' is the same but using an RMA. The latter is actually the basis of RSI calculations before any normalisation is applied, as you can see in the next preset.
RSI
CMO
RSI really should not need explaining, it is however applied a little differently here to the usual, in this case centred around 0. The x100 multiplication factor has been dropped too for the sake of consistency. The same principle applies with CMO, which is basically a 'Simple Delta' version of RSI.
Hard Floor
Soft Floor
These last two are a little different but both can provide useful interpretations. The floor here is simply the lowest value within the chosen length period. 'Hard' plots the difference between the current value and the floor, thus giving a value that is always above 0. In this case, focus should be given to the relative heights of each with a simple interpretation that capital is flowing into those that are climbing and out of those descending. 'Soft' is essentially the same except that the floor is smoothed with an RMA(3), the result being that when new lows are made, the plot will break below 0 before the floor corrects a few bars later. This soft break provides additional information to that given by 'Hard' so is probably the more useful of the two.
------------
To finish it off, a bunch of preset alerts are included for the various 0 crossings.
So that just about covers everything then, all quite straightforward really. Future updates may include some extra stuff, the composition of the stablecoin index may change if necessary too. While this is not really a tweaker's tool like some of my other projects, there's still some room for experimentation here. The 'current' and 'custom' indexes can provide some useful data for compatible altcoins and the possibility to compare inter-related tokens (eg: Doge vs Shib). While i introduced this as a sort of sequel to Dominion, it is not intended as a replacement but more of a companion. This initially started as a feature intended for that one but it quickly grew into its own thing. Both the oscillator view here and the more traditional view have merits, i personally use this one primarily now but frequently refer to Dominion for confirmations etc.
That's it for now anyway. As always, feedback is welcome below. Enjoy!

Bitcoin Correlation MapHello everyone,
This indicator shows the correlation coefficients of altcoins with bitcoin in a table.
What is the correlation coefficient?
The correlation coefficient is a value that takes a value between 0 and 1 when a parity makes similar movements with the reference parity, and takes a value between 0 and -1 when it makes opposite movements.
In order to obtain more meaningful and real-time results in this indicator, the weighted average of the correlation values of the last 200bar was used. You can change the bar length as you wish. With the correlation value, you can see the parities that have similar movements with bitcoin and integrate them into your strategy.
You can change the coin list as you wish, and you can also calculate their correlation with etherium instead of bitcoin .
The indicator shows the correlation value of 36 altcoins at the moment.
The indicator indicates the color of the correlated parities as green and the color of the inversely correlated parities as red.
Cheers

Stablecoins DominanceStablecoins Dominance
The purpose of the script is to show Stablecoin's strength in the crypto markets.
5 Largest Stablecoins divided by Total Market Cap
Altcoin Dominance (without ETH) Excluding Stablecoins UnsymetricAltcoin Dominance (without ETH) Excluding Stablecoins Unsymetric
The purpose of the script is to show Altcoin's strength without Ethereum once we exclude stablecoins.
So we look into all altcoins besides eth and besides stablecoins divided by a value of eth+btc

Altcoin Dominance Excluding EthereumAltcoin Dominance Excluding Ethereum
The purpose of the script is to show Altcoin's strength without Ethereum.
Pretty much shows Altcoin's Dominance in comparison to Market Cap once we exclude Ethereum.

TARVIS Labs - Alts Macro Bottom/Top SignalsSCRIPT DESCRIPTION
PLEASE READ THROUGH THIS CAREFULLY.
This is a script specifically written to help provide indicators from a macro view for ALTS. This script needs to be run on the 1 day. It helps indicate when to accumulate alts, and when its in a bull run when this a bull run top beginning to form with warnings, and a indicator that a top is in. This is described further below.
NOTE - in order to accomodate most alts the script had to be broad enough in its indicators to cover many different scenarios. If you are trading a smaller altcoin I suggest taking a more conservative approach to accumulation.
FAQs:
1. Why is there no accumulation zone showing up before an uptrend?
This could be because the trend has been so strong for this coin that there hasn't been a strong enough signal to accumulate or this could be that the chart doesnt have enough historical data (needs over 2 years) for the indicators to flash green.
2. Why is there no tops shown for a chart Im looking at?
This is either because there isn't enough historical data (needs over 2 years) for the indicators to build or because the altcoin didnt perform as well as the rest of the market. The altcoin has to perform as well as the market over the length of the bull run in order for the signals to show. Typically an altcoin that shows sharp increases and sharp drops shortly after will not have signals show up.
3. The "Potential End of Bull Run Top Indicator" showed up but we weren't near the top yet, why is that?
The alts indicator has to work across many altcoins, and their trends are not all the same. This can lead to the indicator showing but not necessarily being the exact top. The data from the alts macro bottom/top signals should be paired with the "TARVIS Labs bitcoin macro bottom/top signals" indicator for BTC. The reasoning is because if the top is not showing that its in for Bitcoin its likely that the altcoin's top is also not in. You should use the two in tandem to know if the bull run top is very likely in.
ACCUMULATION ZONE INDICATOR - LIGHT GREEN
Description
When we look at the general crypto landscape, the 200d & 300d EMAs are extremely useful. We can use their cross and momentum in order to determine a bottom forming. If the price has fallen over 40% below the 200 day EMA and the 200 day EMA has crossed below the 300d EMA, its a downtrend with a steep fall, which could indicate a good time to accumulate. When we see the 200 day EMA's slope drop drastically (over 5% w/w) it is also a good signal to accumulate.
Strategy for Usage
For alts, the strategy can vary drastically. You need to take into account:
1. the market cap of the altcoin, is it a smaller market cap altcoin or a larger one?
2. historical trend, does it typically trend strongly with a smaller accumulation zone?
Once you've taken these into account you can form a strategy. For example, if the altcoin has had smaller accumulation zones historically you'll want to take advantage of the accumulation zones when they pop up and be more aggressive (say a 30 day accumulation). If the altcoin has historically had longer accumulation zones then you'll want to be more conservative with your strategy and potentially have a 100 day (or even longer) accumulation period. If the altcoin is a smaller market cap alt, you will want to also take that into account. You'll want to likely be more conservative,
STRONG BUY IN ACCUMULATION ZONE INDICATOR - DARK GREEN
Description
We can add to the bottoming signal by looking for strong downtrends inside the bottoming signal. We do this by seeing when the 36 day EMA has a slope decreasing by 2% day/day.
Strategy for Usage
These strong downtrend days can be used to add more to our accumulation strategy. We can add more on these days (ex. double what you were planning to on a typical accumulation day).
LOCAL TOP NEAR BULL RUN TOP INDICATOR - RED
Description
When the 100 week EMA is in a strong uptrend (4% increase w/w) we can look for significant loss of momentum in order to determine if a local top is in near a bull run top. This strategy uses a MACD with 9/36/9 config for the daily chart. We look for the signals momentum loss, when the slope becomes negative.
Strategy for Usage
Ideally the right strategy to use here is to exit the market when this indicator starts. When the indicator ends if the "Potential End of Bull Run Top Indicator" is not showing on the chart you can buy back into the market.
POTENTIAL END OF BULL RUN TOP INDICATOR - DARK RED
Description
When the 100 week EMA is in a strong uptrend (3% increase w/w), and a MACD config of 108/234/9 has a negative signal slope signifying a very large momentum loss, but the 1d 18 EMA is still above the 1d 63 EMA we show this signal.
Strategy for Usage
This is a strong indicator that the top is in, and it potentially being the bull run top. Because alts can vary strongly in their charts, this should be a strong warning but not necessarily a certainty that the bull run is over.

RinarBottombuyRSI, VWMA, MA.
Altcon bottom signals.
buy
White background - bottom point
Yellow - Buy zone
White triangles - a signal to place orders
Sell
Red - sale
RU
RSI , VWMA , MA.
Сигналы дна альтконов.
Buy
Белый фон -точка дна
Желтый - Зона покупки
Белые треугольники - сигнал выставить ордера
Sell
Красный - продажа

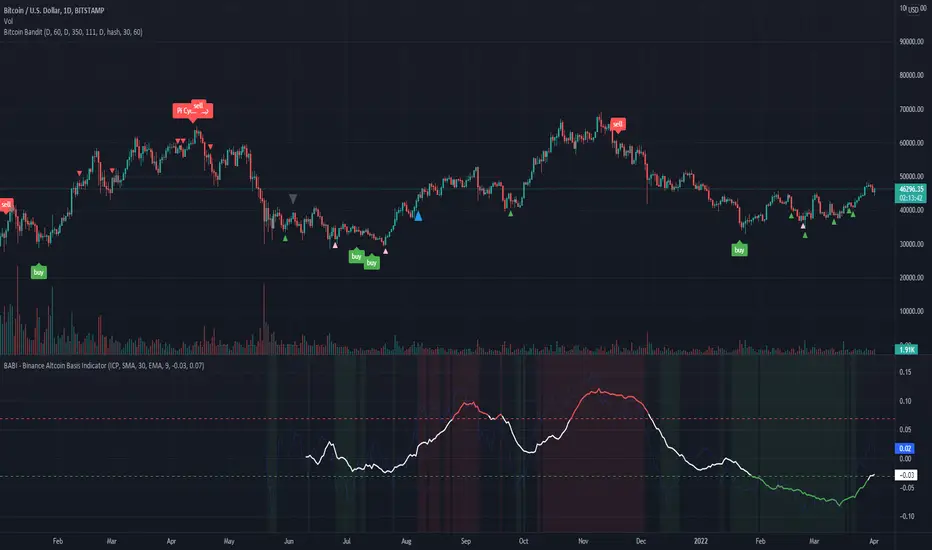
BABI - Binance Altcoin Basis Indicator
This indicator works by taking the basis between various altcoin perpetual futures contracts and spot market indexes on Binance, and then smooths out the data with a basic moving average.
The result is a useful oscillator that shows potential "buy" and "sell" areas.
Simply put, a spot premium is usually bullish and a derivatives premium is usually bearish.
Other versions of this indicator only worked for BTC and ETH, so I have extended its functionality to include popular altcoin trading pairs.
USDT Trading pairs included in this version:
•BTC
•ETH
•LTC
•ICP
•SOL
•LUNA
•GRT
•ATOM
•ADA
•XRP
•ETC
•AVAX
Default setting is BTC. To choose a different oscillator, go to settings and pick your desired crypto.
Thanks for looking. I think you could create a pretty basic trading strategy based on this indicator by simply placing buy and sell orders once the oscillator rises or falls below certain thresholds.
**Credit to @chestbrook on Twitter and Pinnacle_Investor on TradingView
Binance Basis Oscillator ()
BTC Dominance TrendThis simple script applies the DMI/ADX (trend) indicator to the Bitcoin Dominance Index (BTC.D) to check whether BTC is increasing its dominance or not on that day. It is meant to be applied to altcoins on medium intervals. I put it together to test the following hypothesis: On days when BTC dominance is on the rise, altcoins are harder to take off, because Bitcoin is draining the lifeblood out of them, so caution is needed when opening trades.
Olive background means BTC dominance is rising on that day, purple that it is decreasing. White background means it is not moving significantly in any direction.
You can change the resolution (i.e. apply the DMI/ADX to a different BTC.D interval), just make sure to lower the threshold as well. I hope you find a good use for it! Beware if you try to incorporate it in your strategy, it uses higher timeframe data and hence is prone to repainting.

Current to BTC [Morty]This indicator helps you find strong bull altcoin, it shows the ratio of the current symbol to BTC.
Donchian Channels help to identify trends.
Alts Bull coins:
When BTC goes sideway, they pump first.
Alts Bear coins:
When BTC goes sideway, they move sideway.
When BTC goes down, they go down harder.

Aggregated Volume Colored (Bitcoin, ETH, Altcoins, everything)BITSTAMP:BTCUSD
This indicator aggregates trading volume data of up to 10 symbols and can display the individual data by color.
It is useful for assets which are traded on multiple exchanges, like cryptocurrencies, commodities, forex and derivatives showing you what is happening across the market and on the individual exchanges to give you beter insights.
You can change the symbols from which the indicator gathers data in the settings under inputs, just like the colors, and you can add a moving average.
By default trading volume is aggregated from the following symbols:
Binance, BTC /USDT
Binance, BTC /BUSD
Bingbon, BTC /USD
Huobi, BTC /USDT
OkeX, BTC /USDT
Coinbase, BTC /USD
Bitfinex, BTC /USD
Gemini, BTC /USD
Kraken, XBT/USD
Bitstamp, BTC /USD

[JRL] Multi-Symbol Strength TrackerI created this script to compare cryptocurrencies that tend to be correlated, but it could also be used for forex or any other market. It is a fairly simple concept and compares price of each symbol to the specified period ema. This is helpful for tracking highly correlated symbols and visualizing moments when they are out of sync, perhaps signaling good times for buying or selling.