Crypto Performance Index1. The Crypto Performance Index (CPI) estimates the price appreciation of a crypto asset relative to the overall crypto market performance. The indicator is calculated using a Sharpe Ratio principle enhanced with time-domain normalization and cumulative parametrization.
2. The CPI is based on the idea that the performance of an asset should be evaluated not only in terms of its absolute price movement, but also in terms of its risk-adjusted returns compared to the broader market. The Sharpe Ratio, which takes into account both the asset's return and its volatility, is a commonly used measure of risk-adjusted performance.
3. The CPI takes the Sharpe Ratio principle further by incorporating a time-domain normalization technique that adjusts for differences in volatility across different time periods. The cumulative parametrization ensures that the CPI considers the overall performance of the asset over a specified period of time.
4. To use the indicator, select a timeframe and set the standard deviation period (default is 20). The CPI line can be compared against various market benchmarks, including the total crypto market cap (white line), altcoins total market cap (blue line), low-cap altcoins (without ETH), and Bitcoin.
5. An upward slope of the CPI line indicates strong price performance of an asset, with a relatively high chance for the asset to continue growing faster than the market in the future. Conversely, a downward slope of the CPI line indicates weak price performance of an asset, with a relatively high chance for the asset to depreciate in price with respect to the rest of the market in the future.
6. Overall, the CPI provides a comprehensive measure of an asset's price performance, taking into account both its absolute return and its risk-adjusted return relative to the broader market. This makes it a valuable tool for investors looking to evaluate the performance of their crypto holdings and make informed decisions about buying, selling, or holding assets.
Altcoins

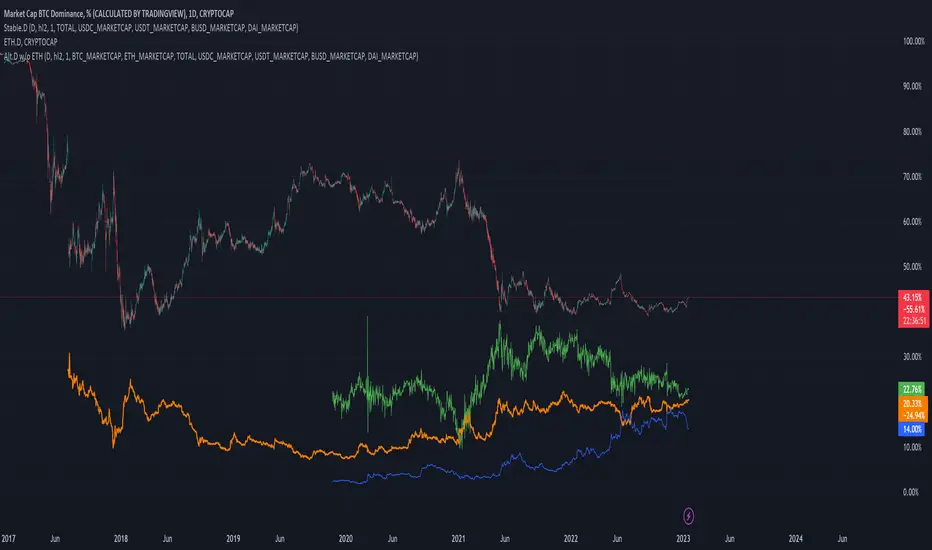
Degen Dominator - (Crypto Dominance Tool) - [mutantdog]A fairly simple one this time. Another crypto dominance tool, consider it a sequel to Dominion if you will. Ready to go out-of-the-box with a selection of presets at hand.
The premise is straightforward, rather than viewing the various marketcap dominance indexes as their standard percentage values, here we have them represented as basic oscillators. This allows for multiple indexes to be viewed in one pane and gives a decent overview of their relative changes and thus the flow of capital within the overall crypto market. As a general rule-of-thumb, when a plot is above zero then the dominance is climbing, thus capital is likely flowing in that direction. The inverse applies when below zero. When the market is quiet, all will be close to zero. Basic overbought/oversold conditions can also be inferred too.
Active as default are:
Bitcoin (0range): CRYPTOCAP:BTC.D
Ethereum (Blue): CRYPTOCAP:ETH.D
Stablecoins (Red): CRYPTOCAP:USDT.D + CRYPTOCAP:USDC.D
Altcoins (Green): 100 - (all of the above)
These are plotted according to the selected oscillator preset and it's length parameter. The default is set to 'EMA Centre'. An optional RMA(3) smoothing filter is also included and active as default. Each index plot has its own colour and opacity settings available on the main page.
Additionally, the following are also available (deactivated as default):
Total DeFi : CRYPTOCAP:TOTALDEFI.D
Current Symbol : Will try to match corresponding dominance index for the chart symbol if available.
Custom Input : Manual text input, will try to match if available.
-------------
The included presets determine the oscillator type used, all are fairly simple and easy to interpret:
EMA Centre
SMA Centre
Median Centre
Midrange Centre
The first 4 are all variations on the same theme, simply calculated as the difference between the actual value and its respective average. EMA is the default and is my personal preference, if you generally favour using an SMA then perhaps that would be your better choice. Like the two MAs, median and midrange are also dependant on the length parameter. Midrange is calculated from the difference between highest and lowest values within the length period, with a little extra smoothing from an RMA(3).
Simple Delta
Weighted Delta
Running Delta
Often referred to as momentum, delta is just change over time. 'Simple' is the most basic of these, the difference between the current value and the value (length) bars prior. A more long-winded way of calculating this would be to take the difference between each bar and its previous then average them with an SMA which results in the same value. 'Weighted' adopts that principle but instead uses a WMA, likewise 'Running' is the same but using an RMA. The latter is actually the basis of RSI calculations before any normalisation is applied, as you can see in the next preset.
RSI
CMO
RSI really should not need explaining, it is however applied a little differently here to the usual, in this case centred around 0. The x100 multiplication factor has been dropped too for the sake of consistency. The same principle applies with CMO, which is basically a 'Simple Delta' version of RSI.
Hard Floor
Soft Floor
These last two are a little different but both can provide useful interpretations. The floor here is simply the lowest value within the chosen length period. 'Hard' plots the difference between the current value and the floor, thus giving a value that is always above 0. In this case, focus should be given to the relative heights of each with a simple interpretation that capital is flowing into those that are climbing and out of those descending. 'Soft' is essentially the same except that the floor is smoothed with an RMA(3), the result being that when new lows are made, the plot will break below 0 before the floor corrects a few bars later. This soft break provides additional information to that given by 'Hard' so is probably the more useful of the two.
------------
To finish it off, a bunch of preset alerts are included for the various 0 crossings.
So that just about covers everything then, all quite straightforward really. Future updates may include some extra stuff, the composition of the stablecoin index may change if necessary too. While this is not really a tweaker's tool like some of my other projects, there's still some room for experimentation here. The 'current' and 'custom' indexes can provide some useful data for compatible altcoins and the possibility to compare inter-related tokens (eg: Doge vs Shib). While i introduced this as a sort of sequel to Dominion, it is not intended as a replacement but more of a companion. This initially started as a feature intended for that one but it quickly grew into its own thing. Both the oscillator view here and the more traditional view have merits, i personally use this one primarily now but frequently refer to Dominion for confirmations etc.
That's it for now anyway. As always, feedback is welcome below. Enjoy!

Bitcoin Correlation MapHello everyone,
This indicator shows the correlation coefficients of altcoins with bitcoin in a table.
What is the correlation coefficient?
The correlation coefficient is a value that takes a value between 0 and 1 when a parity makes similar movements with the reference parity, and takes a value between 0 and -1 when it makes opposite movements.
In order to obtain more meaningful and real-time results in this indicator, the weighted average of the correlation values of the last 200bar was used. You can change the bar length as you wish. With the correlation value, you can see the parities that have similar movements with bitcoin and integrate them into your strategy.
You can change the coin list as you wish, and you can also calculate their correlation with etherium instead of bitcoin .
The indicator shows the correlation value of 36 altcoins at the moment.
The indicator indicates the color of the correlated parities as green and the color of the inversely correlated parities as red.
Cheers

Stablecoins DominanceStablecoins Dominance
The purpose of the script is to show Stablecoin's strength in the crypto markets.
5 Largest Stablecoins divided by Total Market Cap
Altcoin Dominance (without ETH) Excluding Stablecoins UnsymetricAltcoin Dominance (without ETH) Excluding Stablecoins Unsymetric
The purpose of the script is to show Altcoin's strength without Ethereum once we exclude stablecoins.
So we look into all altcoins besides eth and besides stablecoins divided by a value of eth+btc

Altcoin Dominance Excluding EthereumAltcoin Dominance Excluding Ethereum
The purpose of the script is to show Altcoin's strength without Ethereum.
Pretty much shows Altcoin's Dominance in comparison to Market Cap once we exclude Ethereum.

TARVIS Labs - Alts Macro Bottom/Top SignalsSCRIPT DESCRIPTION
PLEASE READ THROUGH THIS CAREFULLY.
This is a script specifically written to help provide indicators from a macro view for ALTS. This script needs to be run on the 1 day. It helps indicate when to accumulate alts, and when its in a bull run when this a bull run top beginning to form with warnings, and a indicator that a top is in. This is described further below.
NOTE - in order to accomodate most alts the script had to be broad enough in its indicators to cover many different scenarios. If you are trading a smaller altcoin I suggest taking a more conservative approach to accumulation.
FAQs:
1. Why is there no accumulation zone showing up before an uptrend?
This could be because the trend has been so strong for this coin that there hasn't been a strong enough signal to accumulate or this could be that the chart doesnt have enough historical data (needs over 2 years) for the indicators to flash green.
2. Why is there no tops shown for a chart Im looking at?
This is either because there isn't enough historical data (needs over 2 years) for the indicators to build or because the altcoin didnt perform as well as the rest of the market. The altcoin has to perform as well as the market over the length of the bull run in order for the signals to show. Typically an altcoin that shows sharp increases and sharp drops shortly after will not have signals show up.
3. The "Potential End of Bull Run Top Indicator" showed up but we weren't near the top yet, why is that?
The alts indicator has to work across many altcoins, and their trends are not all the same. This can lead to the indicator showing but not necessarily being the exact top. The data from the alts macro bottom/top signals should be paired with the "TARVIS Labs bitcoin macro bottom/top signals" indicator for BTC. The reasoning is because if the top is not showing that its in for Bitcoin its likely that the altcoin's top is also not in. You should use the two in tandem to know if the bull run top is very likely in.
ACCUMULATION ZONE INDICATOR - LIGHT GREEN
Description
When we look at the general crypto landscape, the 200d & 300d EMAs are extremely useful. We can use their cross and momentum in order to determine a bottom forming. If the price has fallen over 40% below the 200 day EMA and the 200 day EMA has crossed below the 300d EMA, its a downtrend with a steep fall, which could indicate a good time to accumulate. When we see the 200 day EMA's slope drop drastically (over 5% w/w) it is also a good signal to accumulate.
Strategy for Usage
For alts, the strategy can vary drastically. You need to take into account:
1. the market cap of the altcoin, is it a smaller market cap altcoin or a larger one?
2. historical trend, does it typically trend strongly with a smaller accumulation zone?
Once you've taken these into account you can form a strategy. For example, if the altcoin has had smaller accumulation zones historically you'll want to take advantage of the accumulation zones when they pop up and be more aggressive (say a 30 day accumulation). If the altcoin has historically had longer accumulation zones then you'll want to be more conservative with your strategy and potentially have a 100 day (or even longer) accumulation period. If the altcoin is a smaller market cap alt, you will want to also take that into account. You'll want to likely be more conservative,
STRONG BUY IN ACCUMULATION ZONE INDICATOR - DARK GREEN
Description
We can add to the bottoming signal by looking for strong downtrends inside the bottoming signal. We do this by seeing when the 36 day EMA has a slope decreasing by 2% day/day.
Strategy for Usage
These strong downtrend days can be used to add more to our accumulation strategy. We can add more on these days (ex. double what you were planning to on a typical accumulation day).
LOCAL TOP NEAR BULL RUN TOP INDICATOR - RED
Description
When the 100 week EMA is in a strong uptrend (4% increase w/w) we can look for significant loss of momentum in order to determine if a local top is in near a bull run top. This strategy uses a MACD with 9/36/9 config for the daily chart. We look for the signals momentum loss, when the slope becomes negative.
Strategy for Usage
Ideally the right strategy to use here is to exit the market when this indicator starts. When the indicator ends if the "Potential End of Bull Run Top Indicator" is not showing on the chart you can buy back into the market.
POTENTIAL END OF BULL RUN TOP INDICATOR - DARK RED
Description
When the 100 week EMA is in a strong uptrend (3% increase w/w), and a MACD config of 108/234/9 has a negative signal slope signifying a very large momentum loss, but the 1d 18 EMA is still above the 1d 63 EMA we show this signal.
Strategy for Usage
This is a strong indicator that the top is in, and it potentially being the bull run top. Because alts can vary strongly in their charts, this should be a strong warning but not necessarily a certainty that the bull run is over.

RinarBottombuyRSI, VWMA, MA.
Altcon bottom signals.
buy
White background - bottom point
Yellow - Buy zone
White triangles - a signal to place orders
Sell
Red - sale
RU
RSI , VWMA , MA.
Сигналы дна альтконов.
Buy
Белый фон -точка дна
Желтый - Зона покупки
Белые треугольники - сигнал выставить ордера
Sell
Красный - продажа

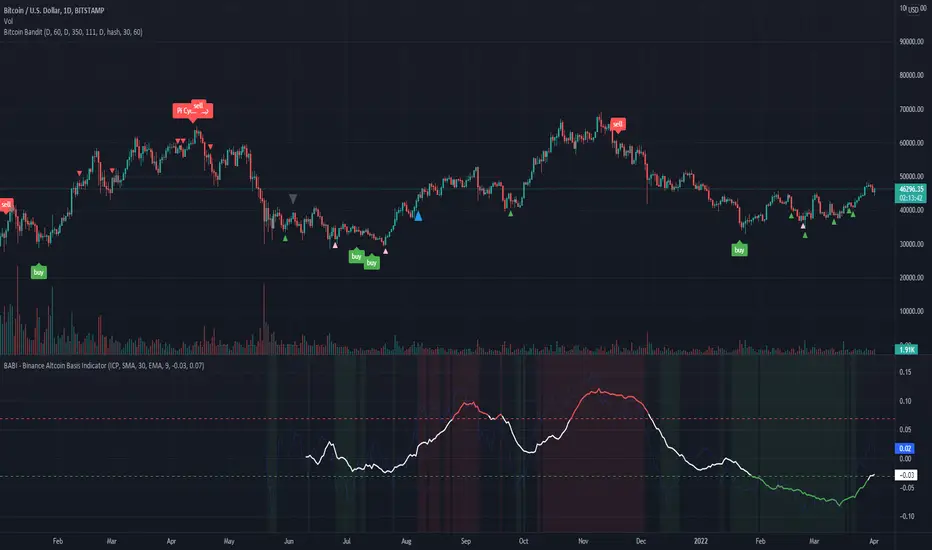
BABI - Binance Altcoin Basis Indicator
This indicator works by taking the basis between various altcoin perpetual futures contracts and spot market indexes on Binance, and then smooths out the data with a basic moving average.
The result is a useful oscillator that shows potential "buy" and "sell" areas.
Simply put, a spot premium is usually bullish and a derivatives premium is usually bearish.
Other versions of this indicator only worked for BTC and ETH, so I have extended its functionality to include popular altcoin trading pairs.
USDT Trading pairs included in this version:
•BTC
•ETH
•LTC
•ICP
•SOL
•LUNA
•GRT
•ATOM
•ADA
•XRP
•ETC
•AVAX
Default setting is BTC. To choose a different oscillator, go to settings and pick your desired crypto.
Thanks for looking. I think you could create a pretty basic trading strategy based on this indicator by simply placing buy and sell orders once the oscillator rises or falls below certain thresholds.
**Credit to @chestbrook on Twitter and Pinnacle_Investor on TradingView
Binance Basis Oscillator ()
[Joy] AladdinDirectly used for entertainment purposes in figuring out the market trend:
Sell/bearish sign: I open a short position on the candle's close. I am bearish on the instrument.
Buy/bullish sign: I open a long position on the candle's close. I am bullish on the instrument.
Red circle: If I run a long position, I take at least 50% unrealized profit into a realized profit on the close candle. I might even convert some portion of the underlying spot into stable coins. I am essentially taking profit along the way as the trend is developing.
Green circle: If I am running a bearish short position, I take at least 50% unrealized profit into a realized profit on the candle's close. I am essentially taking profit along the way as the trend is developing.
Below are used for indications only:
Down Arrows: It is not directly used in opening/closing positions. When the down arrow finishes and the candle close, it sometimes indicates a local top. It does not mean the macro trend has changed.
Up Arrows: It is not directly used in opening/closing positions. When the up arrow finishes and the candle close, it sometimes indicates a local bottom. It does not mean the macro trend has changed.
Red Crosses: It indicates a squeeze may be incoming. When the red crosses finish, the price may move significantly in any one direction. It does not say which direction. It only gives me caution.
Experimental - Below Work in Progress may be from the config only:
>> Jasmine - Tweak of Aladdin
>> Candle color - Logic is different from Aladdin
>> Background color - Logic is different from Aladdin
FAQs
Q: Does it use some EMA /MA/Ichimoku/Parabolic SAR, etc? Does it use any indicator with tweaked settings?
Answer: No.
Q: What does it mostly use?
Answer: Volume and gradual flow of non-interrupted data. The logic depends on the correlation between volume , price bars and the wicks.
Q: Can you make it free or make it open source?
Answer: There is no free lunch in this world. I will never reveal or share the source code or make it free for all!
Q: Do you provide ongoing support for the indicator?
Answer: Yes, I will continue updating the indicator as long as I can. However it depends entirely on me. I may stop updating as well.
Q: Are the bullish /buy & the bearish /sell markers automatic?
Answer: Yes. I do not control it!
Q: Is this financial advice?
Answer: Any views expressed by the indicator are personal entertainment views & shouldn't form a basis for making investment decisions, nor be construed as a recommendation or advice to engage in investment transactions. It is not financial advice. I highly recommend not even think of using this for actual real-life trading with real money. Neither I nor the indicator is responsible for any misuses, including any profit/loss. There is no warranty on this entertainment product

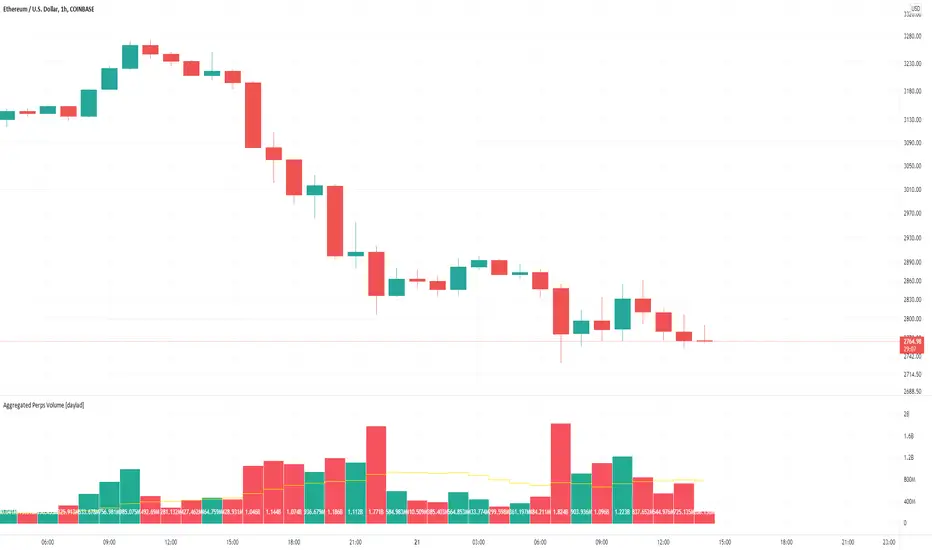
Aggregated Perps Volume [daylad]Same thing as my aggregated spot volume indicator, but for crypto perpetual futures contracts ().
Works with any crypto chart! No need to manually update symbols, this indicator will detect if there is a matching symbol and add it automatically!
The price labels display the total volume per bar in USD.
Pulls data for the following pairs (when available):
BINANCE: + base_symbol + PERP
BINANCE: + base_symbol + BUSDPERP
BINANCE: + base_symbol + USDTPERP
OKEX: + base_symbol + USDTPERP
OKEX: + base_symbol + PERP
FTX: + base_symbol + PERP
PHEMEX: + base_symbol + USD
BYBIT: + base_symbol + USD
BYBIT: + base_symbol + USDT
DERIBIT: + base_symbol + PERP
HUOBI: + base_symbol + PERP
BTSE: + base_symbol + PFC
EXAMPLE -- If you're looking at the COINBASE:SOLUSD chart the indicator will automatically aggregate the volume from BINANCE:SOLPERP, FTX:SOLPERP...etc... BYBIT:SOLUSDT...etc... BTSE:SOLPFC. If an exchange does not have a corresponding pair, then that pair returns 0 and does not add to the total.
If you have any questions feel free to ask. Happy trading!
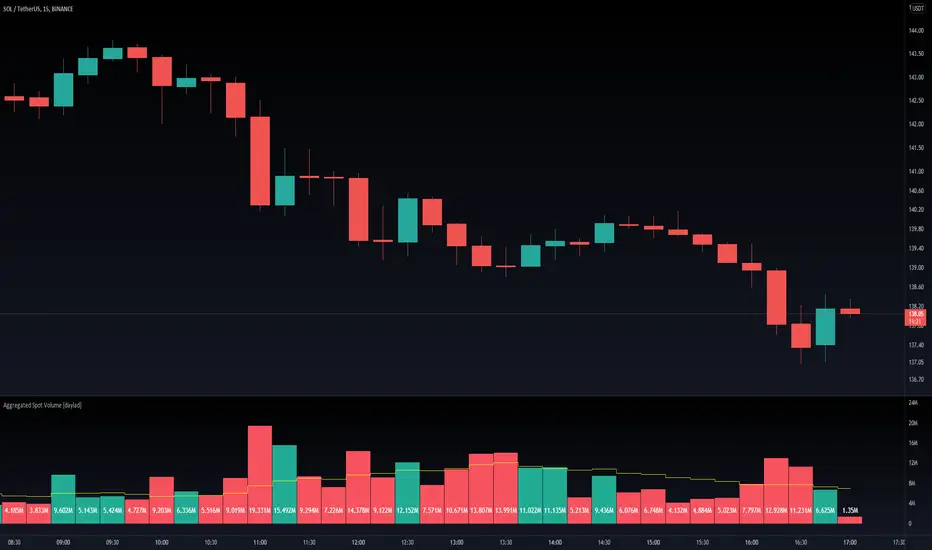
Aggregated Spot Volume [daylad]Works with any crypto chart! Automatically pulls and aggregates trading volume for the top stop pairs.
No need to manually update symbols, this indicator will detect if there is a matching symbol and add it.
Pulls data for the following pairs (when available):
COINBASE: + symbol + USD
COINBASE: + symbol + USDT
COINBASE: + symbol + EUR
BINANCE: + symbol + USDT
BINANCE: + symbol + BUSD
BINANCEUS: + symbol + USD
OKEX: + symbol + USDT
OKEX: + symbol + USDK
FTX: + symbol + USD
HUOBI: + symbol + USDT
BITFINEX: + symbol + USD
KRAKEN: + symbol + USD
KUCOIN: + symbol + USDT
CURRENCYCOM: + symbol + USD
POLONIEX: + symbol + USDT
UPBIT: + symbol + KRW
BITHUMB: + symbol + KRW
EXAMPLE -- If you are looking at the BINANCE:ADAUSDT chart, the indicator will automatically aggregate the volume from COINBASE:ADAUSD, COINBASE:ADAUSDT...etc... BINANCE:ADAUSDT...etc... BITHUMB:ADAKRW. If an exchange does not have a specific pair, then that pair returns 0 (does not add to the total).
If you have any questions feel free to ask. Happy trading!
altcoin strength This indicator measures the relationship between bitcoin and bitcoin dominance and creates a strength index for altcoins. Values above zero add strength to the rise, values below zero add strength to the decline.
bu indikatör bitcoin ve bitcoindominans arasındaki ilişkiyi ölçer ve altcoinler için bir güç endeksi oluşturur sıfırın üstündeki değerler yükselişe güç katar sıfırın altındaki değerler düşüşe güç katar

BTC Dominance TrendThis simple script applies the DMI/ADX (trend) indicator to the Bitcoin Dominance Index (BTC.D) to check whether BTC is increasing its dominance or not on that day. It is meant to be applied to altcoins on medium intervals. I put it together to test the following hypothesis: On days when BTC dominance is on the rise, altcoins are harder to take off, because Bitcoin is draining the lifeblood out of them, so caution is needed when opening trades.
Olive background means BTC dominance is rising on that day, purple that it is decreasing. White background means it is not moving significantly in any direction.
You can change the resolution (i.e. apply the DMI/ADX to a different BTC.D interval), just make sure to lower the threshold as well. I hope you find a good use for it! Beware if you try to incorporate it in your strategy, it uses higher timeframe data and hence is prone to repainting.

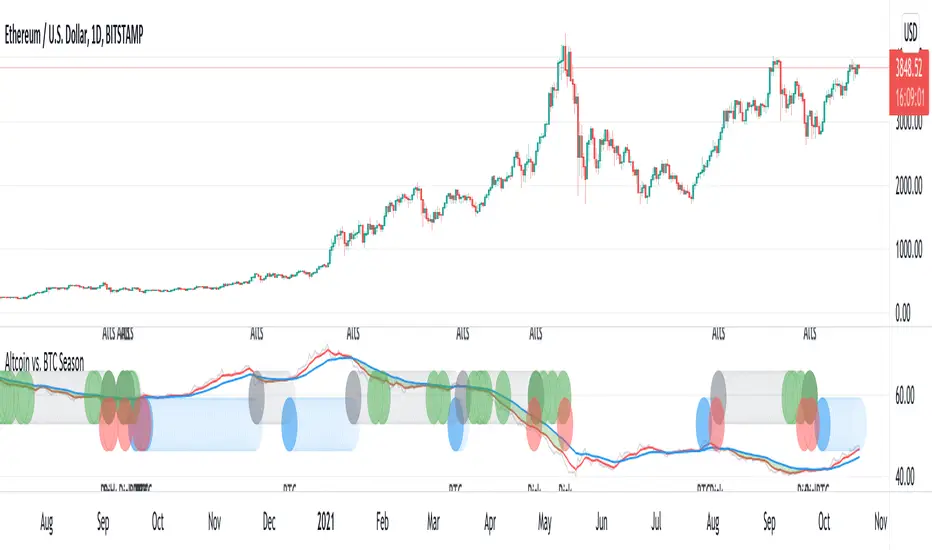
Altcoin vs. BTC SeasonUsing BTC dominance to identify BTC vs. Altcoin season.
Blue: BTC season
Gray: Altcoin season
Green: Altcoin at support - entry with good risk/reward
Red: Potential BTC downside risk
[astropark] Trend Skywalker V2 [alarms]Dear Followers,
today I'm glad to present you Trend Skywalker V2 , the evolution of Trend Skywalker V1 indicator that you can see here below:
This indicator works on every timeframe and market, it's quite responsive to market movements, so it's especially good on volatile markets.
In this new version you have 3 trend clouds available :
a short-term one (yellow)
a mid-term one (green)
a long-term one (blue)
You can also enable an option to show all trend clouds as one, the result will be similar to a special bollinger bands tool.
Of course you can edit trend clouds analysis period and color, also you can turn on or off the cloud that you prefer.
The indicator can run 4 different kinds of strategy : one for each trend cloud individually or a mixed one.
Also the indicator tracks for you a peak profit from entry: this tracker is a suggestion for you to take profits while price goes up!
All red-green circles you see in the chart is a reminder that a peak profit label was there in the past: what does this tell you?
if price starts losing the short-term trend and you had a lot of TP suggestions, maybe trend ended and you should start consider closing your trade before you give back all your profit.
This indicator will let you set alerts on each buy/sell/close/tp label.
For backtesting, you can use the indicator here below:
This is a premium indicator , so send me a private message in order to get access to this script.

Current to BTC [Morty]This indicator helps you find strong bull altcoin, it shows the ratio of the current symbol to BTC.
Donchian Channels help to identify trends.
Alts Bull coins:
When BTC goes sideway, they pump first.
Alts Bear coins:
When BTC goes sideway, they move sideway.
When BTC goes down, they go down harder.

Altcoin Bullrun Guide (4H) by CoinMonitorThis script helps navigate the bullish altcoin market and find the optimal entry points with pre-calculated stop orders. Trade entry is indicated by a gray plate, the stop order level is indicated by a green line. The stop order level must be moved behind the trade until a plate with the result of the trade appears (green - profit, red - loss). The script works optimally on a four-hour timeframe.
The trade will be exited if:
The price will fix below the trend moving line with two candles
The price will cross the stop order level

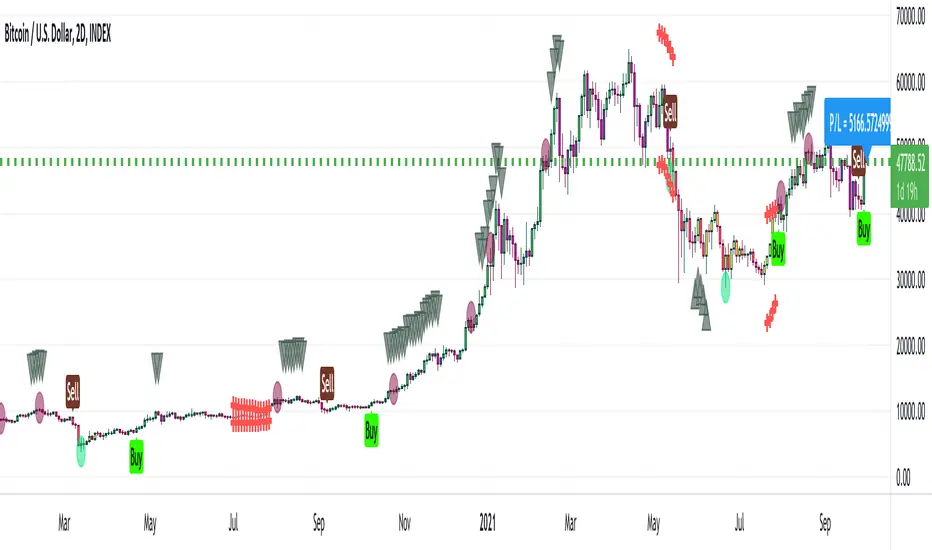
[Joy] Aladdin (1.0.0 Alpha)Explanation of the markers in the indicator
* Bearish / Sell sign: On the candle's close, I open a short position
* Bullish sign: On the candle's close, I open a long position
* Red circle: On the candle's close, I take at least 50% unrealized profit into a realized profit of any running long leverage position. I might even convert some portion of the position into stable coins.
* Green circle: On the candle's close, I take at least 50% unrealized profit into a realized profit of any running short leverage position. I might even convert some portion of the position into stable coins.
* Down Arrows: When the down arrow finishes and the candle close, I put a tighter stop loss of any running long leverage position. It sometimes indicates the local top.
* Up Arrows: When the up arrow finishes and the candle close, I put a tighter stop loss of any running short leverage position. It sometimes indicates the local bottom.
* Purple candle: Weakly bullish.
* Green candle: Strongly bullish
* Red candle: Strongly bearish
* Yellow candle: Weakly bearish
FAQ
Q: Does it use some EMA /MA/etc.? Does it use any indicator with tweaked settings?
Answer: No.
Q: What does it mostly depend on?
Answer: Volume and gradual flow of non-interrupted data. The logic depends purely on volume, price bars and the wicks.
Q: Does it work with all coins, stocks, futures, instruments?
Answer: I prefer to use the exchange with the best possible data. Then backtest out to find the best possible timeframe, stop loss and target all derived from this script data.
Q: Can you make it free or make it open source?
Answer: There is no free lunch in this world. I will never reveal or share the source code!
Q: Do you provide ongoing support for the indicator?
Answer: Yes, as long as I can, I will continue updating the indicator
Q: Are the bullish /buy & the bearish /sell markers automatic?
Answer: I have no control over the markers. It is driven purely by logic from the script.
Q: Is this financial advice?
Answer: This is not financial advice. I do not guarantee any profit or loss. I am not responsible for any of your losses or profits. My indicators do not assure profit or loss. It also does not auto-open or auto-close a trade.
Note:
The Aladdin has been derived from the Super Algorithm Indicator. I have depreciated the Super Algorithm Indicator I have automatically migrated every user to Aladdin, who had Super Algorithm Indicator. One should not use the SA indicator. One should start using this indicator instead.
Version 1
A derived version of Super Algorithm Indicator with optimized code (uses arrays, removes few warnings in the code, makes code more reusable) so that I can add further features in the future. A few new coding features in the pine script encouraged me to go for this version. Since the codebase has been revamped, it made sense for me to make it a new indicator. have also changed a small parameter that is configurable at the moment. Previously it was valued at 26. Now I am putting value at 21.
Aggregated Volume Colored (Bitcoin, ETH, Altcoins, everything)BITSTAMP:BTCUSD
This indicator aggregates trading volume data of up to 10 symbols and can display the individual data by color.
It is useful for assets which are traded on multiple exchanges, like cryptocurrencies, commodities, forex and derivatives showing you what is happening across the market and on the individual exchanges to give you beter insights.
You can change the symbols from which the indicator gathers data in the settings under inputs, just like the colors, and you can add a moving average.
By default trading volume is aggregated from the following symbols:
Binance, BTC /USDT
Binance, BTC /BUSD
Bingbon, BTC /USD
Huobi, BTC /USDT
OkeX, BTC /USDT
Coinbase, BTC /USD
Bitfinex, BTC /USD
Gemini, BTC /USD
Kraken, XBT/USD
Bitstamp, BTC /USD

Binance Futures BasisCONCEPT
The futures basis for multiple coins based on the Binance coin margin quarterly futures contracts.
If you need a run down of what the futures basis is, check out this short educational post (click on the chart):
In short: the futures basis is the premium at which futures contracts are trading compared to the spot market.
FEATURES
Futures basis for the following coins:
BTC
ETH
LTC
BNB
ADA
DOT
BCH
LINK
There's also an average futures basis which is an average premium of all the coins I just listed.
As you can see there's also a zero line which you can turn on in the settings.
This is quite useful for when the futures start trading in or close to backwardation.
It's possible to show all the premiums at the same time.
This makes it easy to look for outliers.
You can choose the candle source too.
By default it's set on "close" which probably makes the most sense.
All data will be based on candle closes.
However if you're looking at higher timeframes sometimes crucial info is lost when you keep it on "close".
As you can see in this BTC futures basis example with "close" as a candle source you don't seen anything peculiar even though there were two violent liquidation cascades that temporarily had a huge impact on the futures basis.
If you then select "ohlc4" for example which uses an average value of each candle you can clearly see the impact that those drops had.
Basically when you're looking at most recent data I prefer candle close, but when looking at higher timeframes for historic data the ohlc4 option is more useful.
At the time of publishing this indicator it's using the September quarterly futures contracts (which is the closest expiration).
I'll update this every time the expiration happens.
However, in the settings you'll find the code for these futures contracts.
If you want to take a look at the next expiration for example, which is December right now, you can just fill in the Binance code of those contracts and it'll re-calculate everything and print the futures basis for the December futures.
This way you can also update the indicator yourself each time contracts expire (to make sure the indicator keeps working just in case I were to disappear or something).
The code for the current (September) contracts is U2021.
The code for the next expiration (December) is Z2021.
This will become out dated of course.
TRADING
You can find more info on how it's useful for trading in the educational post I linked.
Some short notes...
This premium works very similar to the perpetuals basis or funding.
Simply put a high premium could be a sign that the market is overbought and a very low premium could be a sign that the market is oversold.
Backwardation (below 0) is very rare and usually only happens after a violent crash. Historically those are good buying opportunities.
Divergences also often work really well.
If you want access send me a private message so we can discuss it.
Cheers.

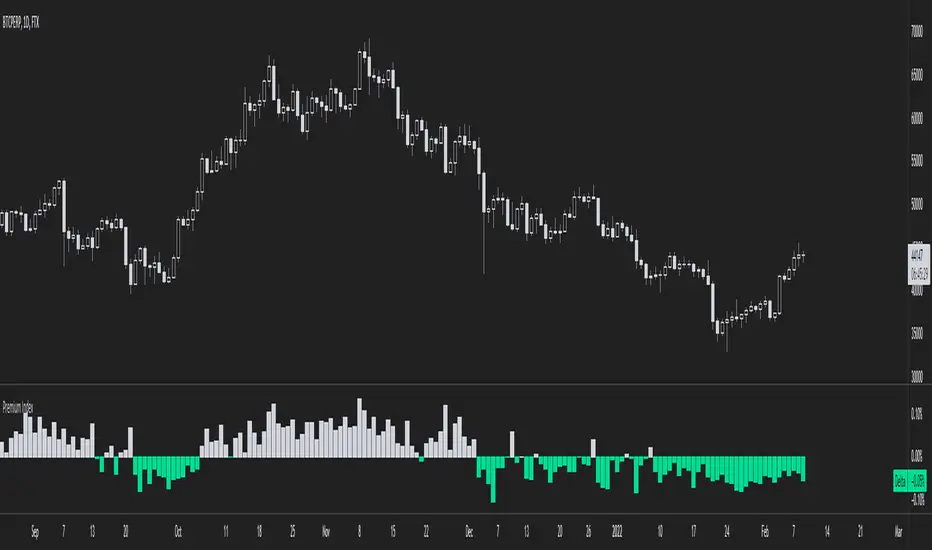
Binance Premium IndexCONCEPT
An indicator with official Binance premium index data for BTC and a bunch of altcoins.
The premium index is based on the difference in price between the perpetual swap contract last price and the price of a volume weighted spot index.
Simply put: it shows you for each coin whether the spot market is trading higher than the Binance perp or not.
FEATURES
Premium index for:
BTC
ETH
LTC
BNB
ADA
DOGE
DOT
UNI
SOL
LINK
There's also an average premium based on the premiums of all these coins combined.
You can also choose in the settings to display all the premiums at the same time.
This makes it easy to find outliers.
There are two extra features that need some explaining.
First of all: the clamp.
It doesn't happen often, but sometimes as a result of massive liquidation cascades there's temporarily a huge spot premium (or derivs premium, but usually spot premium).
In such a scenario the value of the premium dwarfs all other historical data and the indicator becomes nearly unreadable.
The clamp option allows you to put a cap on how extreme the values can get so that the indicator becomes easier to read again.
In the settings you can also change what you want the max value to be.
When you select the option that shows all premiums you'll definitely run into this problem as well.
But you can put a clamp on these too.
The second option is more straight forward: smoothing.
The premium can sometimes be a bit all over the place. It's possible to display the data as a smoothed moving average.
Here's an example of the raw data of the global average premium.
Now with smoothing. Looks a lot more clean.
TRADING
This premium index data is what the funding rate is based on.
Thus it has a direct impact on the perpetual swap contract.
If there's a spot premium (negative values in green) funding will be negative and shorts will have to pay longs.
If there's a derivatives premium (positive values in grey) funding will be positive and longs will have to pay shorts.
Simply put, a spot premium is usually bullish and a derivatives premium is usually bearish.
A lot of people look at this stuff when it comes to bitcoin, but for altcoins it's also definitely relevant.
So here's an indicator with the premium index for 10 different coins.
I don't use more than 10 coins because otherwise the indicator will become very slow.
If you want access to the indicator send me a private message so we can discuss it.
Cheers.
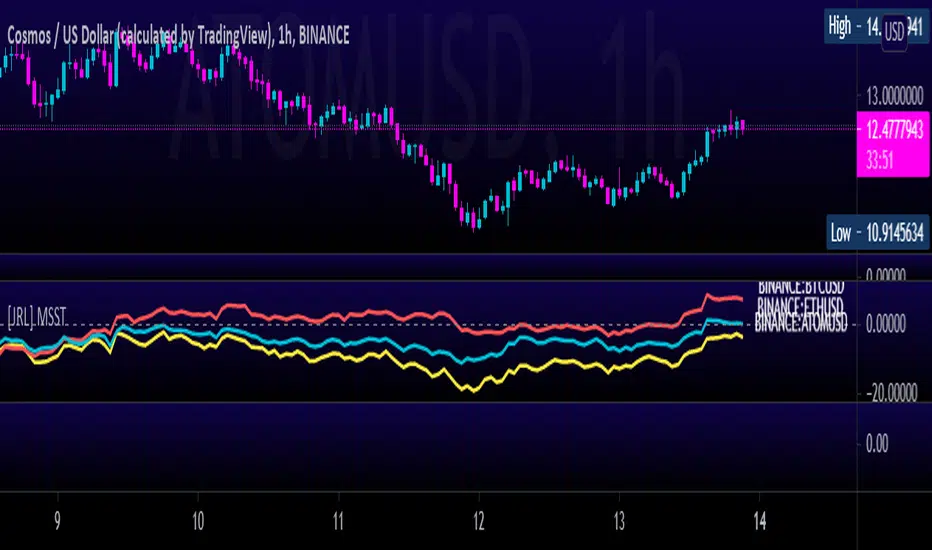
[JRL] Multi-Symbol Strength TrackerI created this script to compare cryptocurrencies that tend to be correlated, but it could also be used for forex or any other market. It is a fairly simple concept and compares price of each symbol to the specified period ema. This is helpful for tracking highly correlated symbols and visualizing moments when they are out of sync, perhaps signaling good times for buying or selling.